Autochartist General
MARKET ANALYSIS

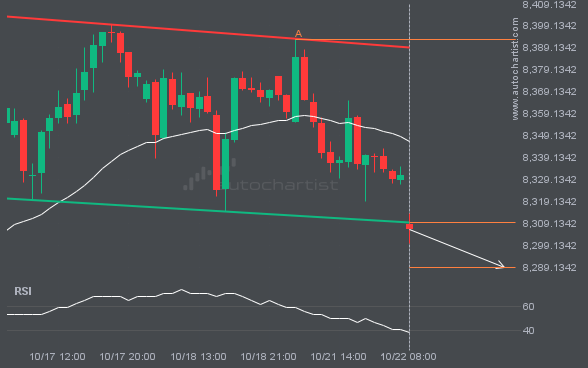
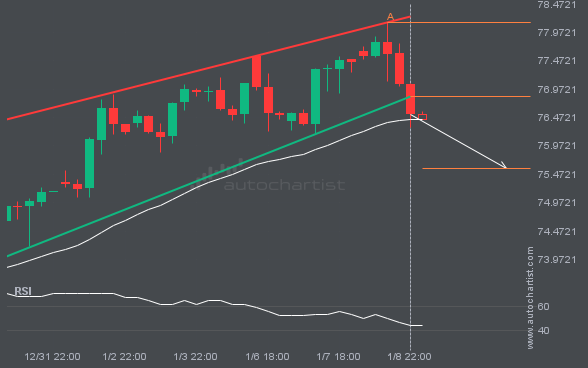
Descending Triangle pattern identified on FTSE100 has broken through a support level with the price momentum continuing to move in an downward direction. A solid trading opportunity continues with the price expected to reach 8289.2557 in the next 13.

The breakout of BRN/USD through the resistance line of a Falling Wedge could be a sign of the road ahead.

NGC/USD moved through the resistance line of a Channel Down at 2.268646341463415 on the 30 Minutes chart. This line has

USDJPY moved through the support line of a Channel Up at 149.38331818181823 on the 4 hour chart. This line has

This trade setup on XAUUSD is formed by a period of consolidation; a period in which the price primarily moves

ETHUSD is moving towards a resistance line. Because we have seen it retrace from this line before, we could see

GBPJPY has broken through a resistance line of a Ascending Triangle chart pattern. If this breakout holds true, we may

A movement of 6.32% over 2 days on XAGUSD doesn’t go unnoticed. You may start considering where it’s heading next,