Skip to content
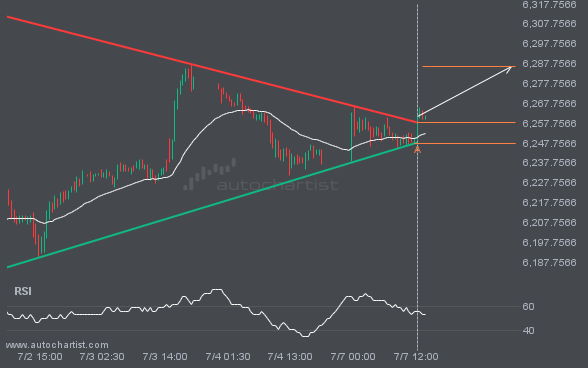
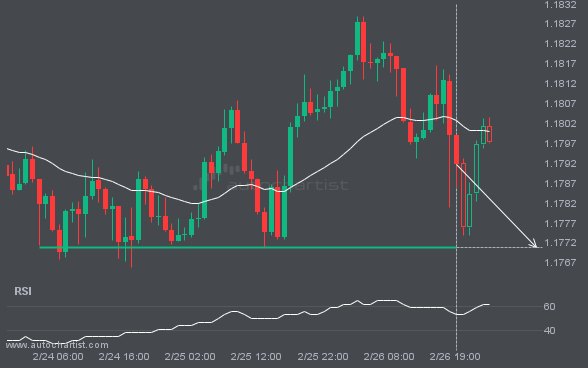
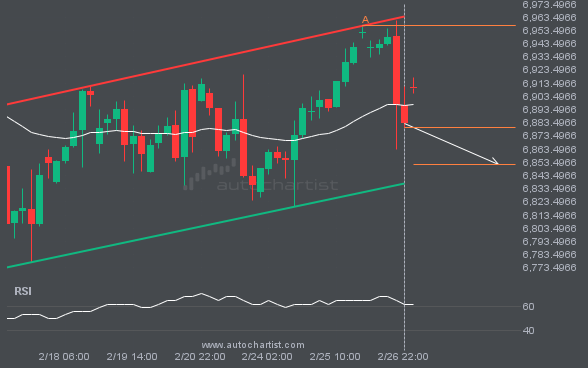
 S&P500 moved through the resistance line of a Triangle at 6258.341666666667 on the 30 Minutes chart. This line has been tested a number of times in the past and this breakout could mean an upcoming change from the current trend. It may continue in its current direction toward 6286.2379.