...
MARKET ANALYSIS

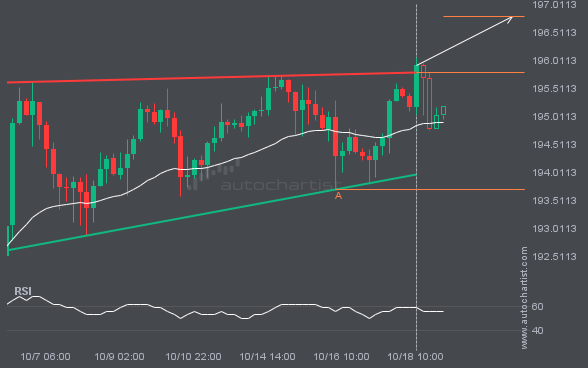
GBPJPY has broken through a resistance line of a Ascending Triangle chart pattern. If this breakout holds true, we may see the price of GBPJPY testing 196.7880 within the next 3 days. But don’t be so quick to trade, it has tested this line in the past, so you should confirm the breakout before taking any action.

You would be well advised to confirm the breakout that has just occurred – do you believe the move through

Descending Triangle pattern identified on FTSE100 has broken through a support level with the price momentum continuing to move in

EURUSD has moved lower by 2.82% from 1.11299 to 1.08155 in the last 28 days.

The breakout of BRN/USD through the resistance line of a Falling Wedge could be a sign of the road ahead.

NGC/USD moved through the resistance line of a Channel Down at 2.268646341463415 on the 30 Minutes chart. This line has

USDJPY moved through the support line of a Channel Up at 149.38331818181823 on the 4 hour chart. This line has

This trade setup on XAUUSD is formed by a period of consolidation; a period in which the price primarily moves