...
MARKET ANALYSIS

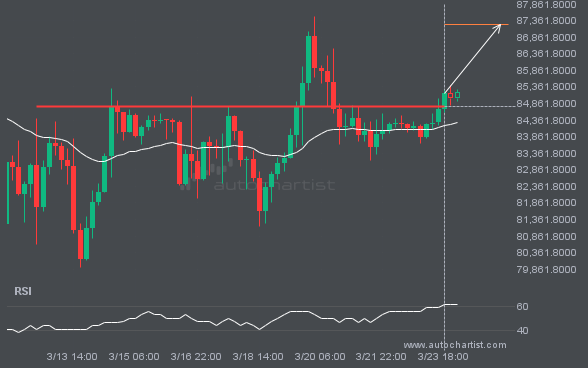
BTCUSD has broken through a line of 84760.9766. If this breakout holds true, we could see the price of BTCUSD heading towards 87253.0938 within the next 3 days. But don’t be so quick to trade, it has tested this line numerous times in the past, so you should probably confirm the breakout before placing any trades.

LTCUSD is moving toward a key resistance level at 87.2900. LTCUSD has tested this level 4 times before, and on each occasion it has bounced off. Could this be the time it finally breaks through?

Channel Up pattern identified on NAS100 has broken through a support level, with price momentum continuing to move downward. This presents a solid trading opportunity, with the price expected to reach 25502.9658 in the next 12.

ETHUSD is trapped in a Triangle formation, implying that a breakout is imminent. This is a strong trade setup for both trend and swing traders. It is now approaching a resistance line that has been tested before. Divergence watchers may be optimistic about a potential breakout, which could mark the start of a new trend. […]

An emerging Rising Wedge has been detected on USDJPY. The pattern has not yet broken through support, but the price is expected to move up over the next few hours. At the time the pattern was found, the price was 156.1155, and it is expected to move to 156.4702.

The last 8 4 hour candles on XAUUSD have formed a Flag pattern and broken out through the pattern lines, indicating a possible bearish movement toward the price level at 4153.1840.

The price of S&P500 is heading back toward the support area. It may struggle to break through and could reverse direction. The price may eventually break through, but it typically retreats from the level several times before doing so.

GBPJPY is heading toward the resistance line in a Ascending Triangle pattern. If this move continues, the price of GBPJPY could test 207.4282 within the next 2 days. It has tested this line many times before, so the move could be short-lived and may rebound as it has before.