 Skip to content
 S&P500 is heading towards a line of 6742.4302. If this movement continues, the price of S&P500 could test 6742.4302 within
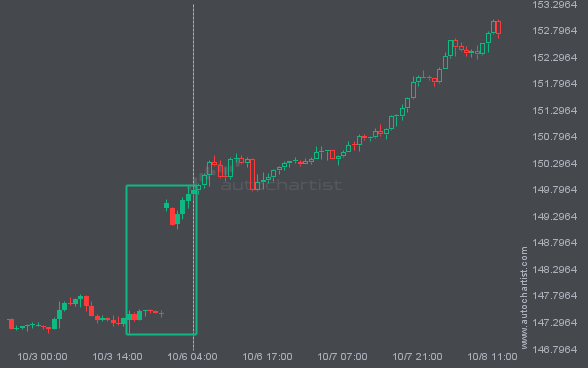
USDJPY just posted a 1.58% move over the past 3 days – a move that won’t go unnoticed by any trading style.
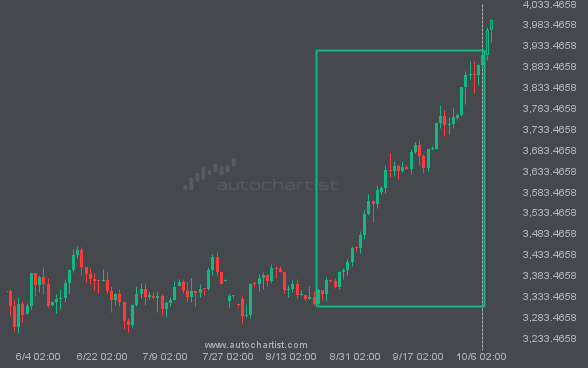
XAUUSD just posted a 16.81% move over the past 48 days – a move that won’t go unnoticed by any trading style.
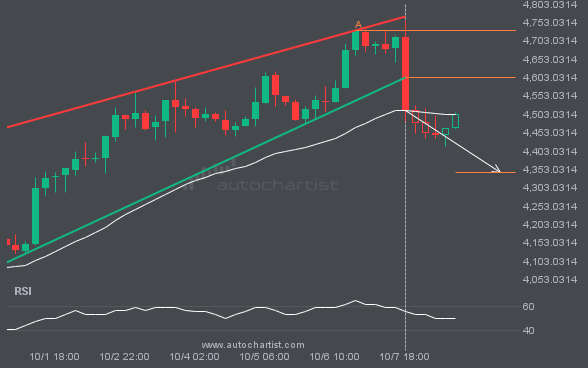
Rising Wedge pattern identified on ETHUSD has broken through a support level with the price momentum continuing to move in an downward direction. A solid trading opportunity continues with the price expected to reach 4345.3579 in the next 2.
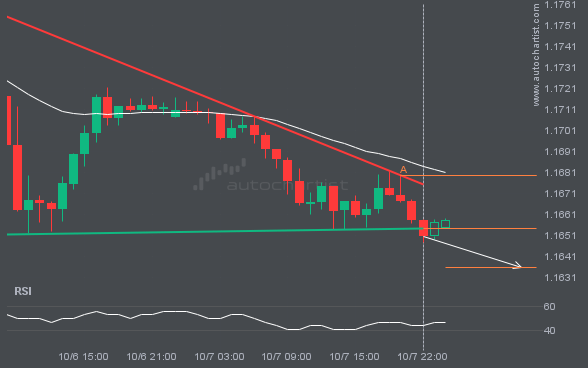
This trade setup on EURUSD is formed by a period of consolidation; a period in which the price primarily moves sideways before choosing a new direction for the longer term. Because of the bearish breakout through support, it seems to suggest that we could see the next price move to 1.1636.
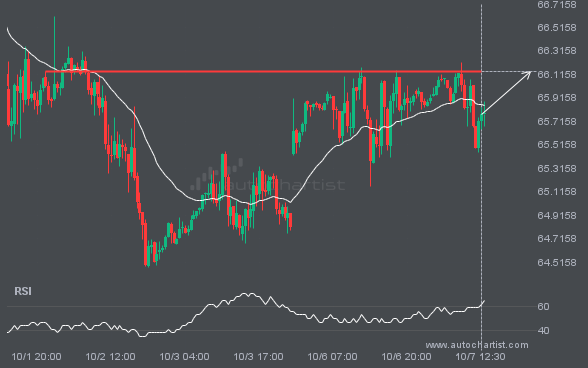
A strong resistance level has been identified at 66.1425 on the 30 Minutes BRN/USD chart. BRN/USD is likely to test it soon.
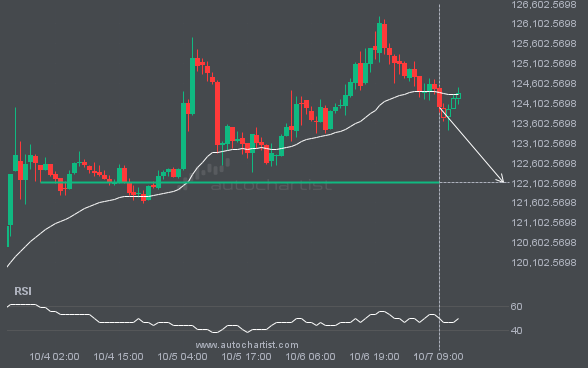
BTCUSD is about to retest a key horizontal support level near 122113.6172. It has tested this level 4 times in the recent past and could simply bounce off like it did last time. However, after this many tries, maybe it’s ready to start a new trend.
Autochartist provides an extensive analytics toolset with features to take your trading to the next level. Empower your day-to-day trading decisions with an unrivalled breadth and depth of analysis driven by advanced algorithms, powerful big-data technology, and user-friendly trading tools.

