 Skip to content
 NAS100 reached 24644.1037 after a 2.57% move spanning 3 days.
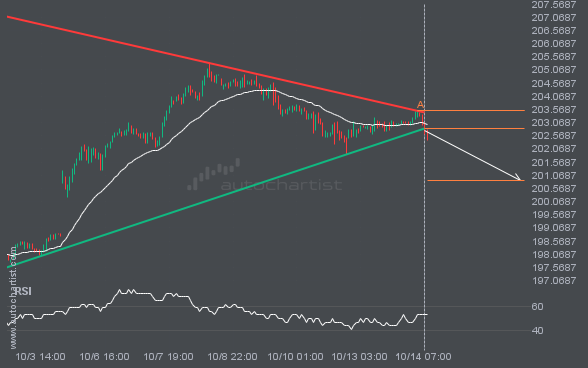
The breakout of GBPJPY through the support line of a Triangle could be a sign of the road ahead. If this breakout persists, we may see the price of GBPJPY testing 200.8861 within the next 3 days.
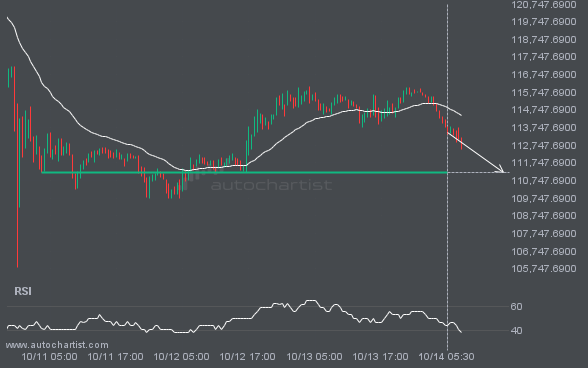
BTCUSD is heading towards 111208.2891 and could reach this point within the next 15 hours. It has tested this line numerous times in the past, and this time could be no different, ending in a rebound instead of a breakout. If the breakout doesn’t happen, we could see a retracement back down to current levels.
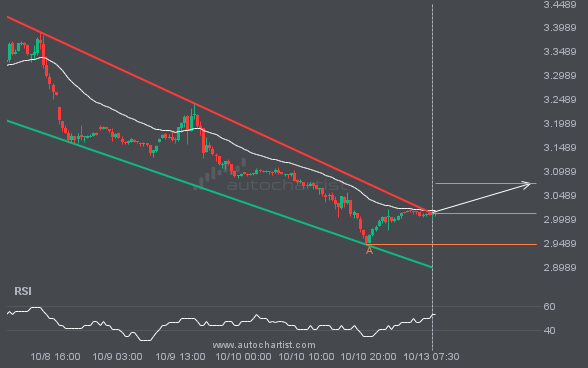
NGC/USD has broken through the resistance line of a Channel Down technical chart pattern. Because we have seen it retrace from this line in the past, one should wait for confirmation of the breakout before taking any action. It has touched this line twice in the last 7 days and suggests a possible target level […]
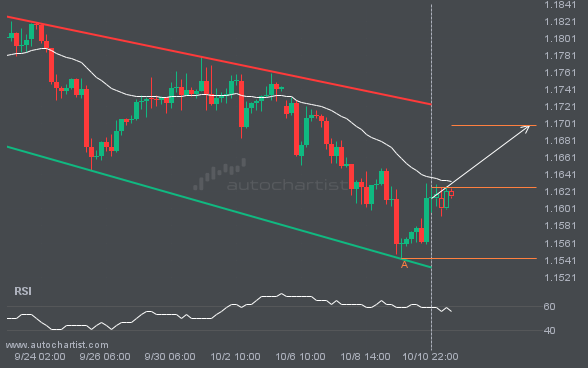
EURUSD is heading towards the resistance line of a Channel Down and could reach this point within the next 2 days. It has tested this line numerous times in the past, and this time could be no different from the past, ending in a rebound instead of a breakout. If the breakout doesn’t happen, we […]
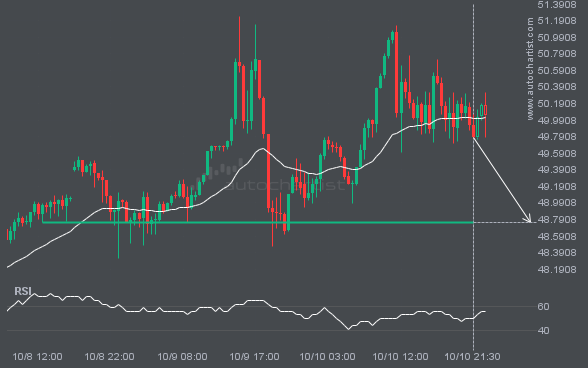
The movement of XAGUSD towards 48.7532 price line is yet another test of the line it reached numerous times in the past. We could expect this test to happen in the next 11 hours, but it is uncertain whether it will result in a breakout through this line, or simply rebound back to current lines.
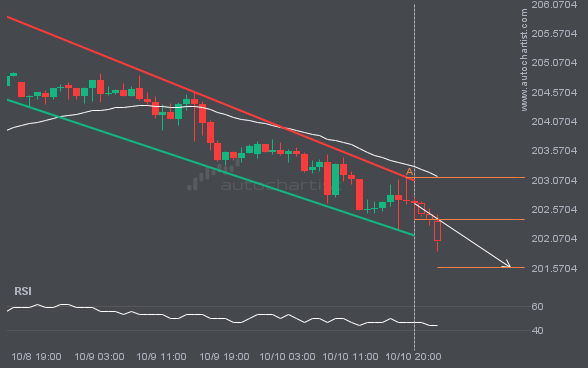
A Channel Down pattern was identified on GBPJPY at 202.397, creating an expectation that it may move to the support line at 201.5819. It may break through that line and continue the bearish trend or it may reverse from that line.
Autochartist provides an extensive analytics toolset with features to take your trading to the next level. Empower your day-to-day trading decisions with an unrivalled breadth and depth of analysis driven by advanced algorithms, powerful big-data technology, and user-friendly trading tools.

