 Skip to content
 EURUSD is trapped in a Channel Up formation, implying that a breakout is Imminent. This is a great trade-setup for
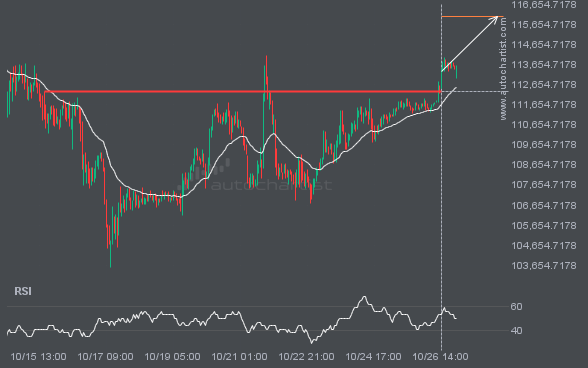
A strong resistance level has been breached at 112326.8906 on the 1 hour BTCUSD chart. Technical Analysis theory forecasts a movement to 116030.7813 in the next 2 days.
XAUUSD has broken through a resistance line. It has touched this line at least twice in the last 8 days. This breakout may indicate a potential move to 4249.0527 within the next 19 hours. Because we have seen it retrace from this position in the past, one should wait for confirmation of the breakout before […]
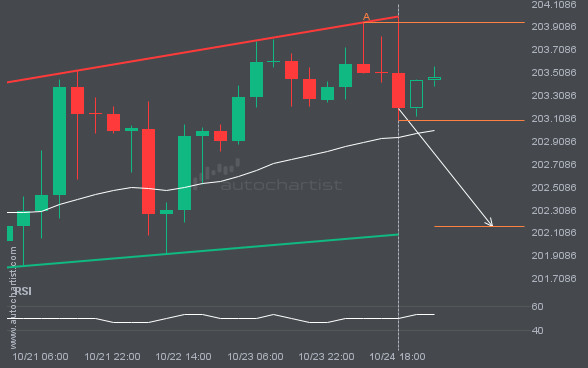
A Channel Up pattern was identified on GBPJPY at 203.0885, creating an expectation that it may move to the support line at 202.1617. It may break through that line and continue the bearish trend or it may reverse from that line.
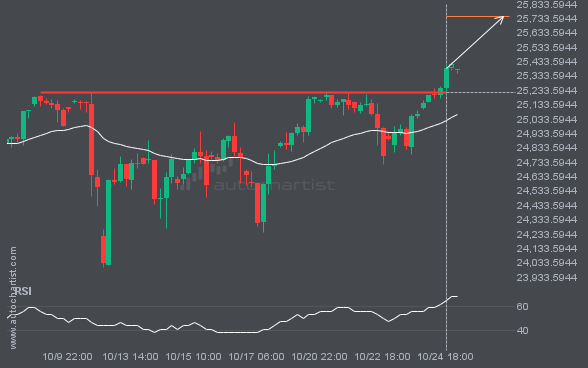
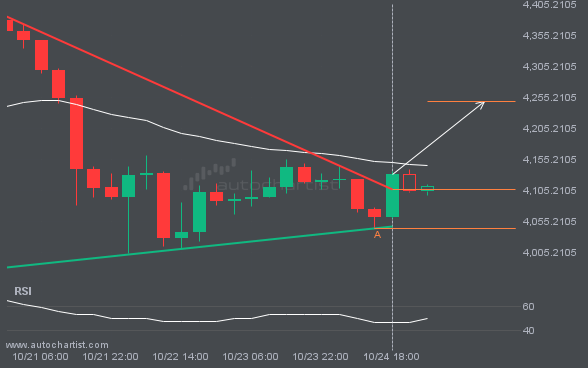
NAS100 has broken through a resistance line. It has touched this line numerous times in the last 16 days. This breakout shows a potential move to 25746.3457 within the next 3 days. Because we have seen it retrace from this level in the past, one should wait for confirmation of the breakout.
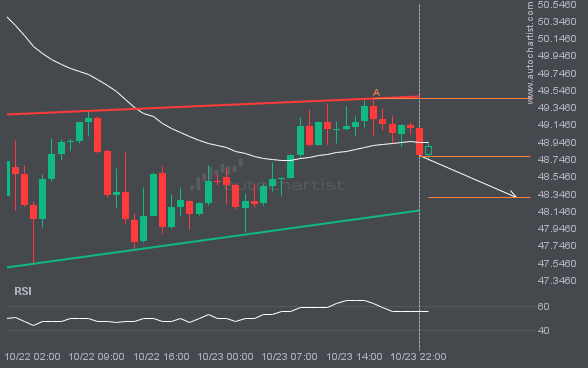
XAGUSD is moving towards a support line which it has tested numerous times in the past. We have seen it retrace from this line before, so at this stage it isn’t clear whether it will breach this line or rebound as it did before. If XAGUSD continues in its current trajectory, we could see it […]
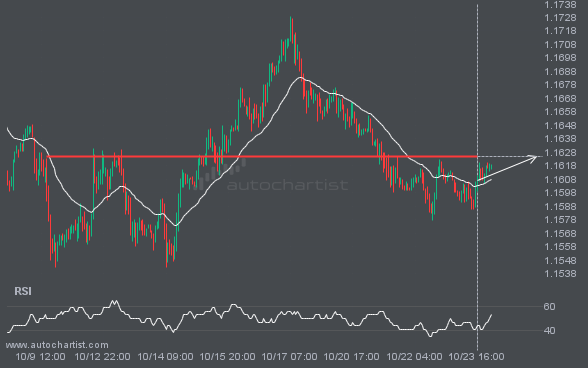
EURUSD is moving towards a key resistance level at 1.1625. EURUSD has previously tested this level 4 times and on each occasion it has bounced back off this level. Is this finally the time it will break through?
Autochartist provides an extensive analytics toolset with features to take your trading to the next level. Empower your day-to-day trading decisions with an unrivalled breadth and depth of analysis driven by advanced algorithms, powerful big-data technology, and user-friendly trading tools.

