 Skip to content
 XAGUSD is heading towards the resistance line of a Rising Wedge. If this movement continues, the price of XAGUSD could
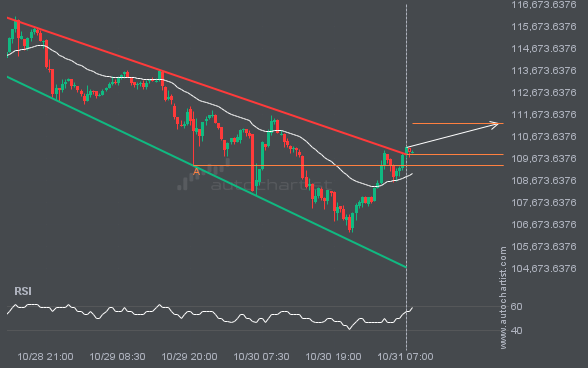
You would be well advised to confirm the breakout that has just occurred – do you believe the move through resistance to be significant? Do you have confirming indicators that the price momentum will continue? If so, look for a target of 111264.4263 but consider reducing the size of your position as the price gets […]
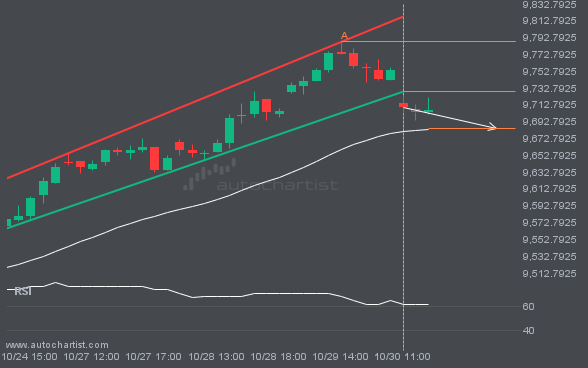
ETHUSD is moving towards a resistance line. Because we have seen it retrace from this line before, we could see either a break through this line, or a rebound back to current levels. It has touched this line numerous times in the last 4 days and may test it again within the next 16 hours.
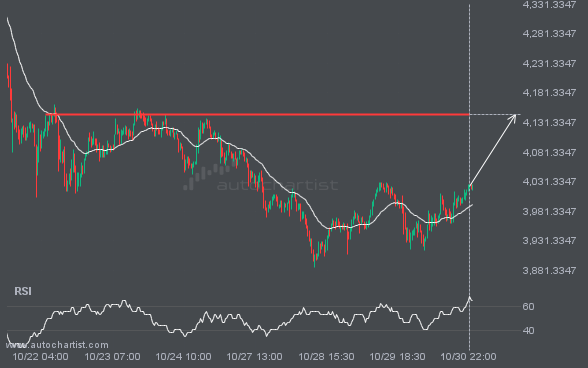
XAUUSD is en route to a very important line that will be a definite deciding factor of what is to come! We may see this trajectory continue to touch and break through 4144.3652, unless it runs out of momentum and pulls back to current levels.
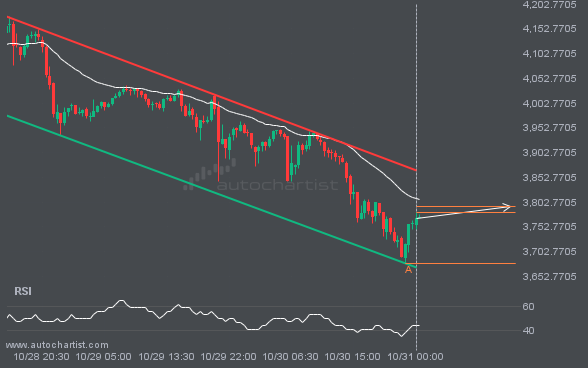
FTSE100 has broken through a support line of a Channel Up and suggests a possible movement to 9684.9809 within the next 7 hours. It has tested this line in the past, so one should probably wait for a confirmation of this breakout before taking action. If the breakout doesn’t confirm, we could see a retracement […]
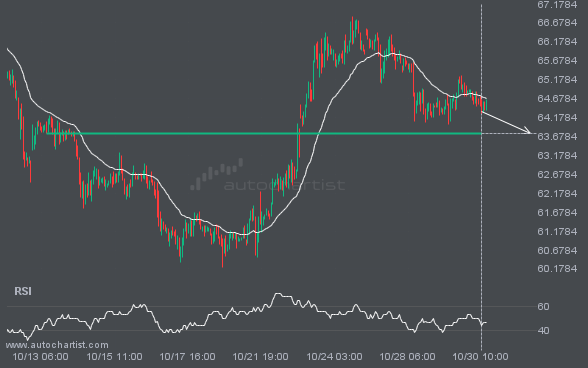
BRN/USD is heading towards a line of 63.7660. If this movement continues, the price of BRN/USD could test 63.7660 within the next 3 days. But don’t be so quick to trade, it has tested this line numerous times in the past, so this movement could be short-lived and end up rebounding.
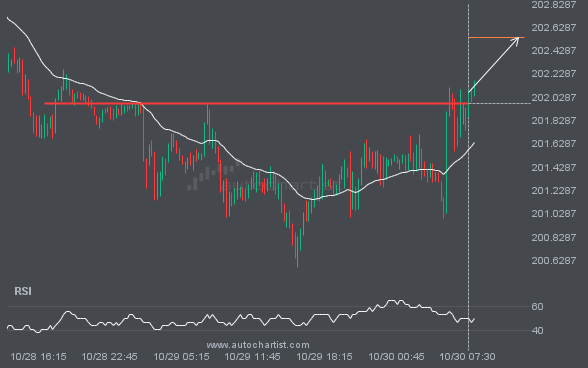
GBPJPY has broken through 201.9750 which it has tested numerous times in the past. We have seen it retrace from this price in the past. If this new trend persists, GBPJPY may be heading towards 202.5424 within the next 9 hours.
Autochartist provides an extensive analytics toolset with features to take your trading to the next level. Empower your day-to-day trading decisions with an unrivalled breadth and depth of analysis driven by advanced algorithms, powerful big-data technology, and user-friendly trading tools.

