 Skip to content
 Emerging Rising Wedge detected on BRN/USD – the pattern is an emerging one and has not yet broken through support,
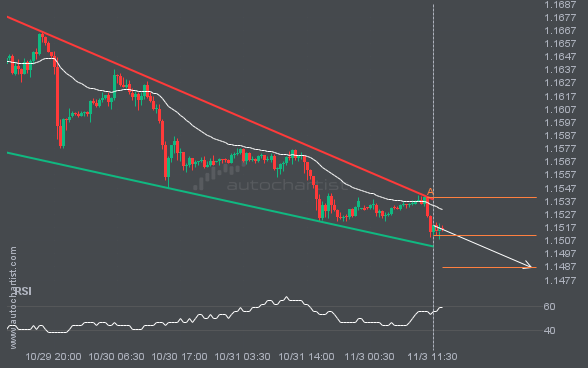
EURUSD is moving towards a support line. Because we have seen it retrace from this line before, we could see either a break through this line, or a rebound back to current levels. It has touched this line numerous times in the last 6 days and may test it again within the next 19 hours.
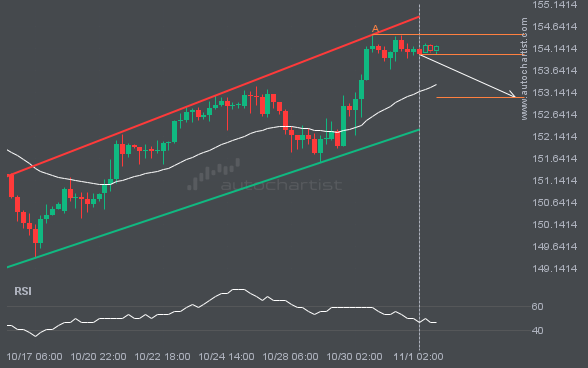
USDJPY is moving towards a support line. Because we have seen it retrace from this line before, we could see either a break through this line, or a rebound back to current levels. It has touched this line numerous times in the last 19 days and may test it again within the next 2 days.

The breakout of NAS100 through the support line of a Triangle could be a sign of the road ahead. If this breakout persists, we may see the price of NAS100 testing 25445.6219 within the next 2 days.
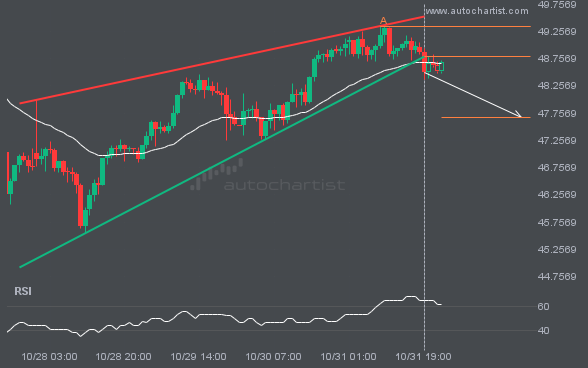
XAGUSD has broken through a support line of a Rising Wedge and suggests a possible movement to 47.6817 within the next 2 days. It has tested this line in the past, so one should probably wait for a confirmation of this breakout before taking action. If the breakout doesn’t confirm, we could see a retracement […]
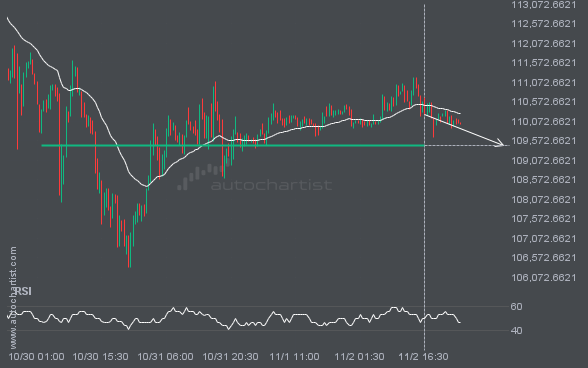
BTCUSD is moving towards a support line. Because we have seen it retrace from this level in the past, we could see either a break through this line, or a rebound back to current levels. It has touched this line numerous times in the last 4 days and may test it again within the next […]
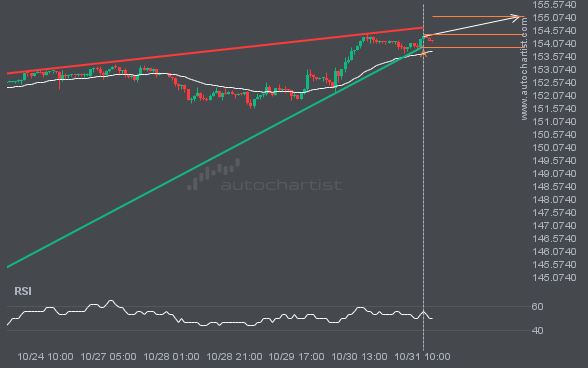
An emerging Rising Wedge has been detected on USDJPY on the 1 hour chart. There is a possible move towards 155.0917 next few candles. Once reaching support it may continue its bullish run or reverse back to current price levels.
Autochartist provides an extensive analytics toolset with features to take your trading to the next level. Empower your day-to-day trading decisions with an unrivalled breadth and depth of analysis driven by advanced algorithms, powerful big-data technology, and user-friendly trading tools.

