 Skip to content
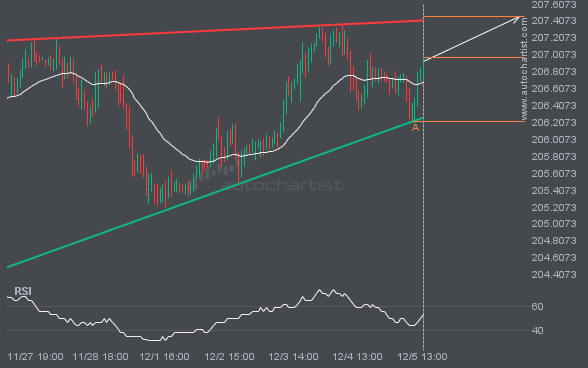
 The price of S&P500 is heading back toward the support area. It may struggle to break through and could reverse
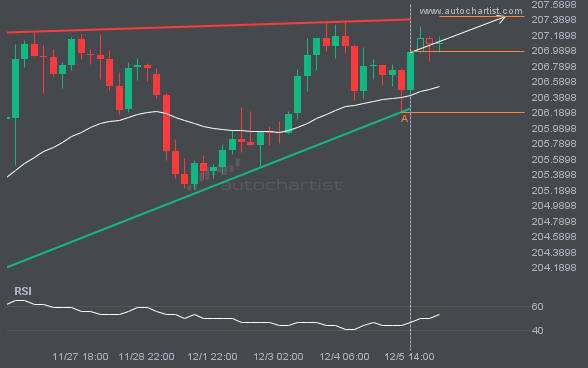
GBPJPY is heading toward the resistance line in a Ascending Triangle pattern. If this move continues, the price of GBPJPY could test 207.4282 within the next 2 days. It has tested this line many times before, so the move could be short-lived and may rebound as it has before.

A breakout of FTSE100 through the support line of a Triangle could signal what’s ahead. If the breakout persists, we may see FTSE100’s price test 9591.5231 within the next 2 days.
The movement of LTCUSD toward the resistance line of a Triangle is yet another test of the line it has reached numerous times in the past. This test of the line could occur within the next 4 days, but it is uncertain whether it will result in a breakout through this line or simply rebound […]
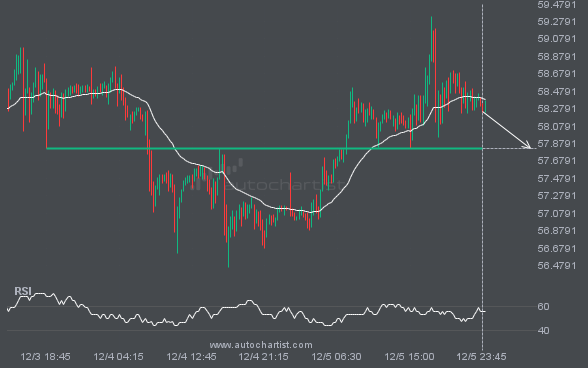
XAGUSD is approaching a critical level that could be a key deciding factor for what comes next. We may see this trajectory continue to test and break through 57.8255, unless it loses momentum and pulls back to current levels.
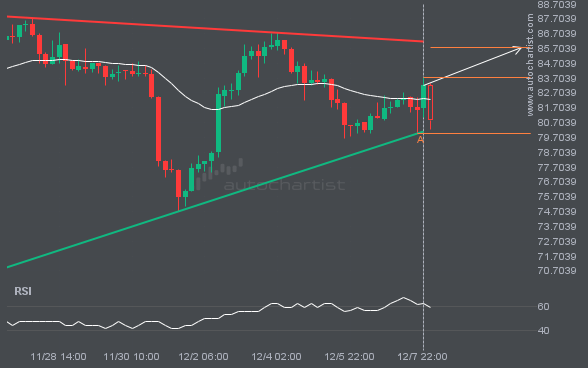
GBPJPY is heading toward the resistance line of a Rising Wedge pattern and could reach it within the next 2 days. It has tested this line numerous times before, and this time may be no different, ending in a rebound instead of a breakout. If a breakout doesn’t occur, we could see a retracement back […]
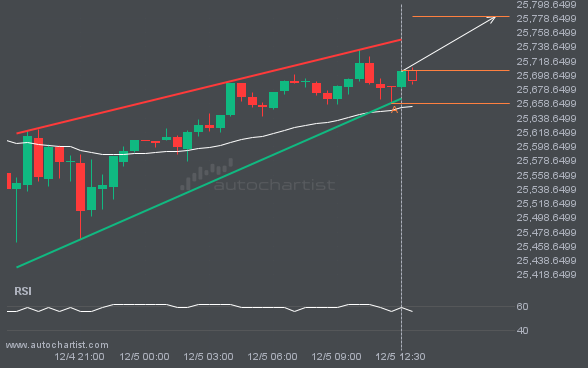
NAS100 is moving toward a resistance line it has tested many times. It has retraced from this line before, so it’s unclear whether it will break through or rebound again. If NAS100 continues on its current trajectory, it could reach 25781.0429 within the next 5 hours.
Autochartist provides an extensive analytics toolset with features to take your trading to the next level. Empower your day-to-day trading decisions with an unrivalled breadth and depth of analysis driven by advanced algorithms, powerful big-data technology, and user-friendly trading tools.

