 Skip to content
 NAS100 is moving toward a key resistance level at 25578.7988. This level has been tested before for NAS100. This may
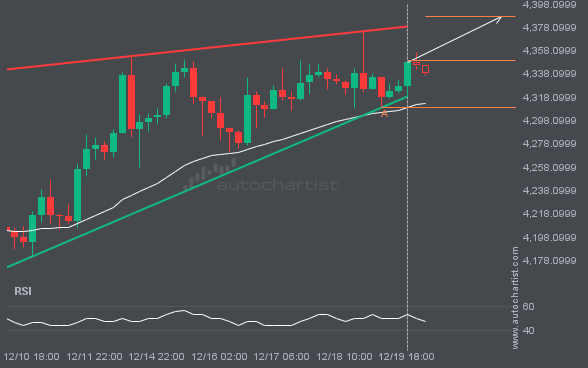
XAUUSD is moving toward a resistance line. Since it has retraced from this line before, we may see either a breakout through it or a rebound to current levels. It has touched this line multiple times in the past 10 days and may test it again within the next 2 days.
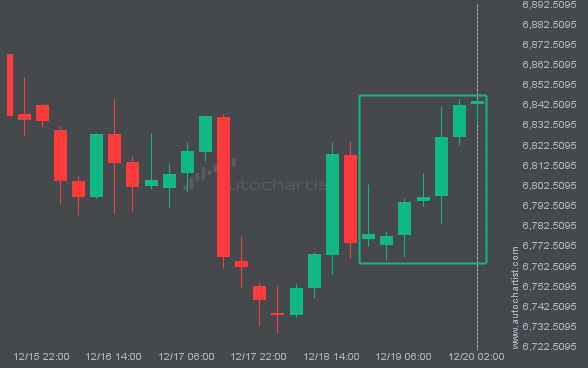
S&P500 recorded an unusual number of bullish candles on the 4 hour timeframe.
GBPJPY: Significant movement recorded.
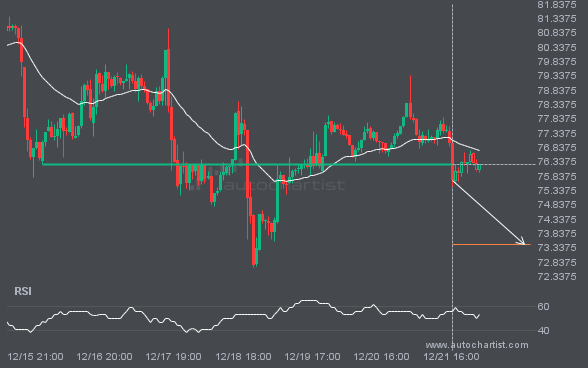
LTCUSD has broken through a line at 76.2300. If this breakout holds, we could see the price of LTCUSD move toward 73.4370 within the next 2 days. However, don’t be too quick to trade. It has tested this line many times in the past, so confirm the breakout before placing any trades.
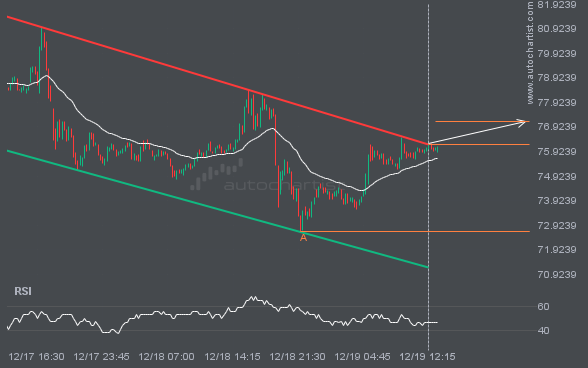
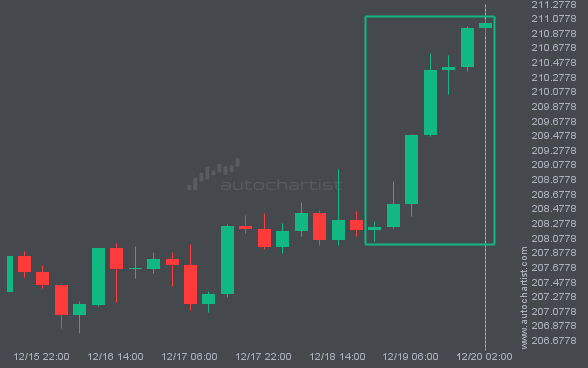
The last 3 15 Minutes candles on LTCUSD have formed a Channel Down pattern and broken out through the pattern lines, indicating a possible bullish movement toward the price level at 77.1613.
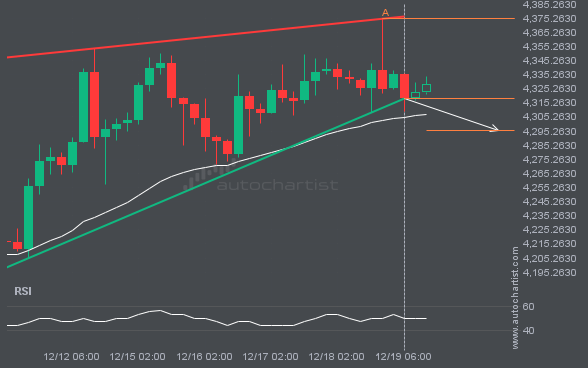
XAUUSD has broken through the support line, which it has tested twice before. We have seen it retrace from this line before, so wait for confirmation of the breakout before trading. If this new trend persists, a target level around 4295.5352 may materialize within the next 2 days.
Autochartist provides an extensive analytics toolset with features to take your trading to the next level. Empower your day-to-day trading decisions with an unrivalled breadth and depth of analysis driven by advanced algorithms, powerful big-data technology, and user-friendly trading tools.

