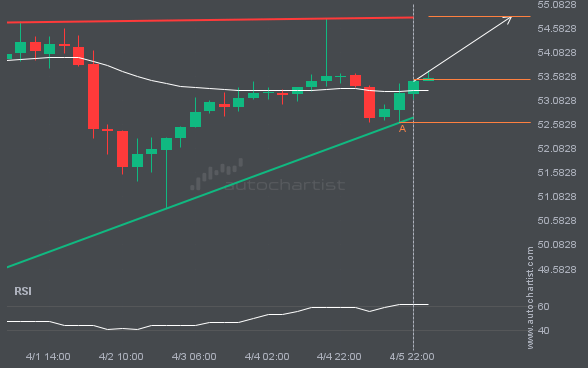
LTCUSD is trapped in a Ascending Triangle formation, implying that a breakout is imminent. This is a strong trade setup for both trend and swing traders. It is now approaching a support line that has been tested before. Divergence watchers may be optimistic about a potential breakout, which could mark the start of a new […]
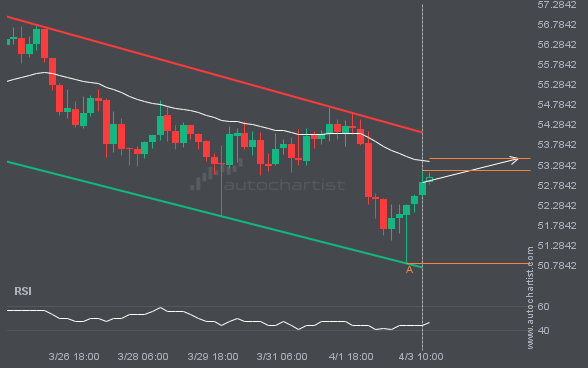
NGC/USD is moving toward a resistance line. Since it has retraced from this line before, we may see either a breakout through this line or a rebound to current levels. It has touched this line numerous times in the last 3 days and may test it again within the next 17 hours.
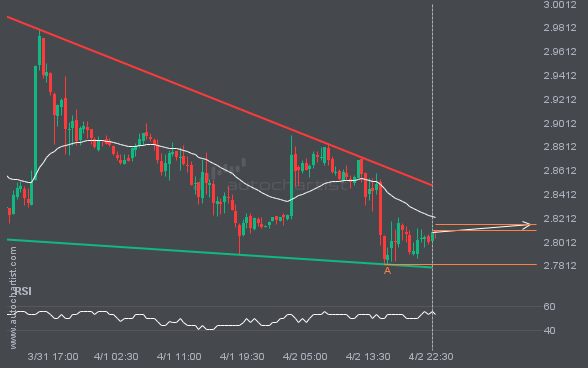
The movement of LTCUSD toward the resistance line of a Channel Down is yet another test of the line it has reached numerous times in the past. This test of the line could occur within the next 3 days, but it is uncertain whether it will result in a breakout through this line or simply […]
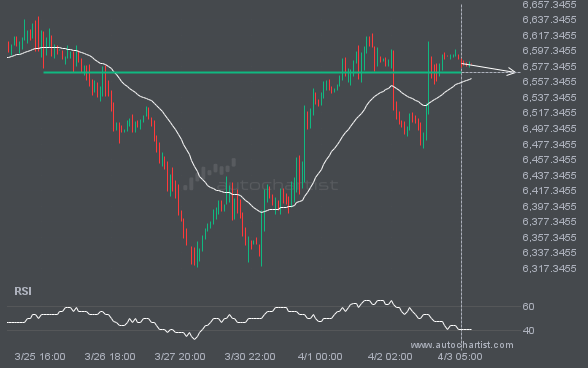
S&P500 is approaching a support line at 6569.7998. If it hits the support line, it may break through this level to continue the bearish trend, or it may return to current levels.
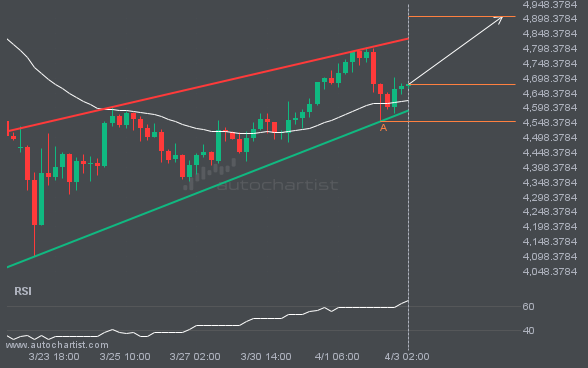
XAUUSD is moving toward a resistance line it has tested many times. It has retraced from this line before, so it’s unclear whether it will break through or rebound again. If XAUUSD continues on its current trajectory, it could reach 4906.1557 within the next 3 days.
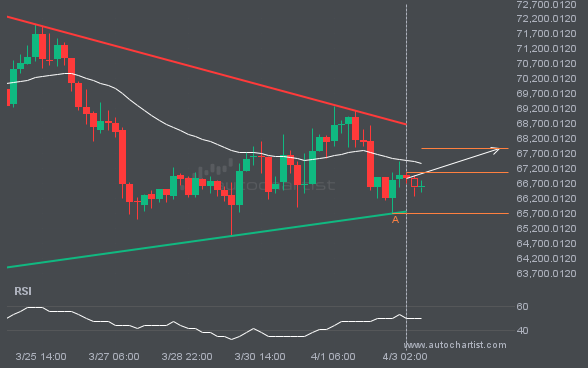
An emerging Triangle pattern has been detected for BTCUSD on the 4 hour chart. There may be a move toward 67868.3611 in the next few candles. Once it reaches the resistance, it may continue its bullish run or revert to current price levels.
Enjoy Access to Premium Autochartist
Trading Tools - Sign Up and Explore for Free Now!
Autochartist provides an extensive analytics toolset with features to take your trading to the next level. Empower your day-to-day trading decisions with an unrivalled breadth and depth of analysis driven by advanced algorithms, powerful big-data technology, and user-friendly trading tools.