 Skip to content
 FTSE100 was identified around 10172.6 after recently rebounding off the support on the 30 Minutes interval. Ultimately, the stock’s price
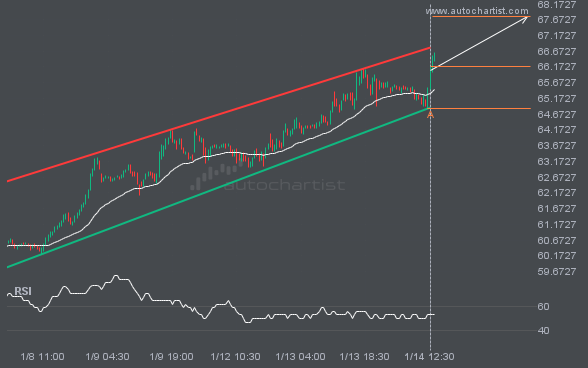
BRN/USD is moving toward a resistance line. Since it has retraced from this line before, we may see either a breakout through it or a rebound to current levels. It has touched this line multiple times in the past 7 days and may test it again within the next 2 days.
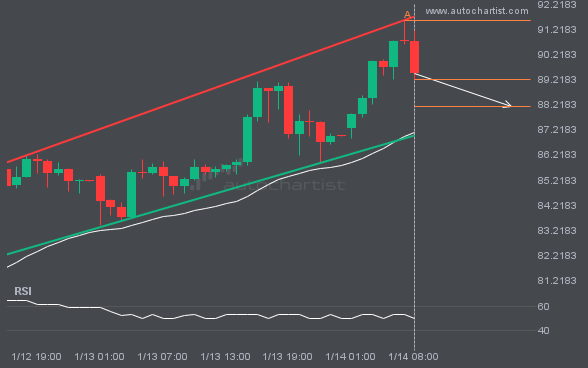
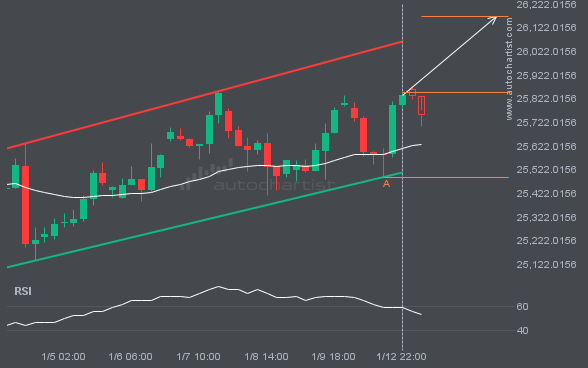
An emerging Channel Up pattern in its final wave has been identified on the XAGUSD 1 hour chart. After a strong bearish run, XAGUSD is heading toward the upper triangle trendline, with possible resistance at 88.1277. If the support holds, the Channel Up pattern suggests a rebound toward current levels.
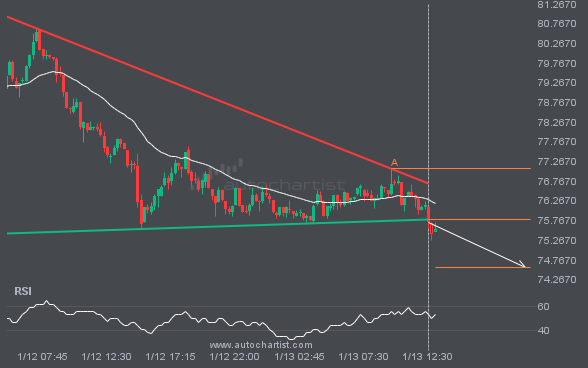
LTCUSD has broken through the support line of a Descending Triangle technical chart pattern. Because it has retraced from this line in the past, you should wait for confirmation of the breakout before taking any action. It has touched this line twice in the last 2 days, suggesting a possible target level around 74.5781 within […]
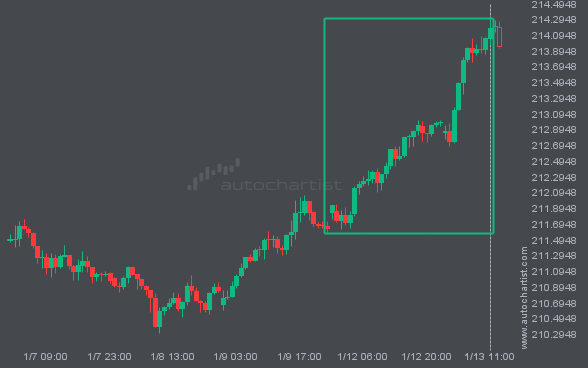
GBPJPY recorded an exceptional 1.21% move over the last 4 days. Whether you follow trends or look for reversals, this move is hard to ignore.
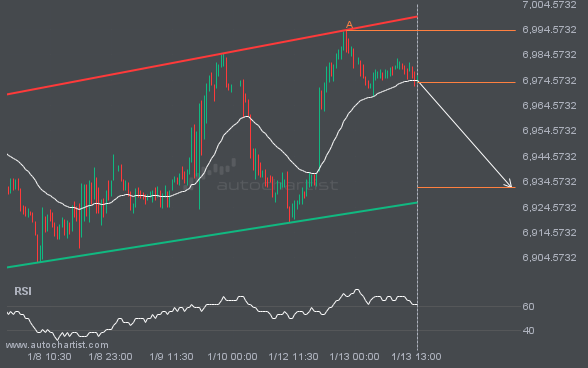
An emerging Channel Up pattern has been detected for S&P500 on the 30 Minutes chart. There may be a move toward 6932.1902 in the next few candles. Once it reaches the support, it may continue its bearish run or revert to current price levels.
NAS100 is moving toward a resistance line. Since it has retraced from this line before, we may see either a breakout through it or a rebound to current levels. It has touched this line multiple times in the past 13 days and may test it again within the next 2 days.
Autochartist provides an extensive analytics toolset with features to take your trading to the next level. Empower your day-to-day trading decisions with an unrivalled breadth and depth of analysis driven by advanced algorithms, powerful big-data technology, and user-friendly trading tools.

