 Skip to content
 The movement of FTSE100 toward the support line of a Triangle is yet another test of the line it has
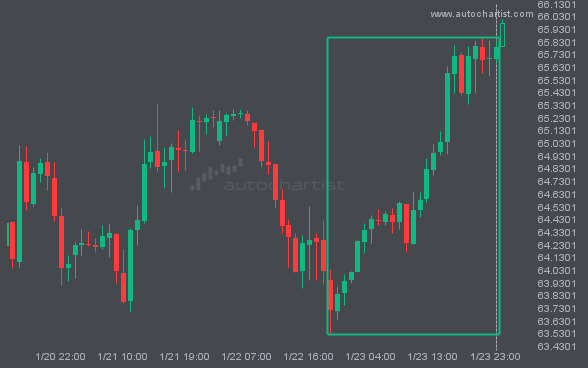
BRN/USD recorded a significant move over the last day—one of its largest in recent sessions.
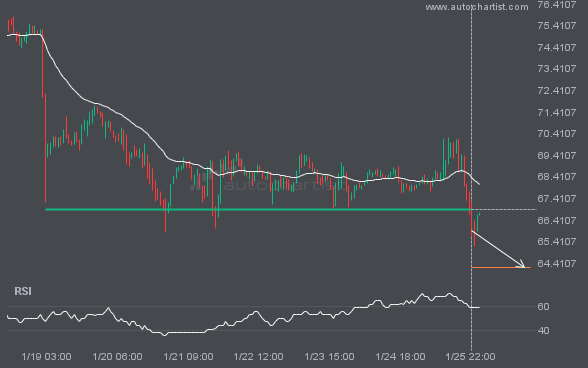
LTCUSD has broken through a support line. Since it has previously retraced from this price, wait for confirmation of the breakout before trading. It has touched this line several times over the past 7 days. This suggests a possible target around 64.2160 within the next 2 days.
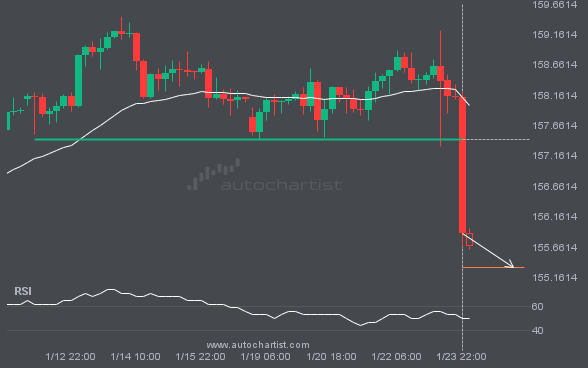
USDJPY has broken through a support line. Because it has previously retraced from this price, you should wait for confirmation of the breakout before trading. It has touched this line multiple times over the past 12 days, which suggests a possible target around 155.3263 within the next 3 days.
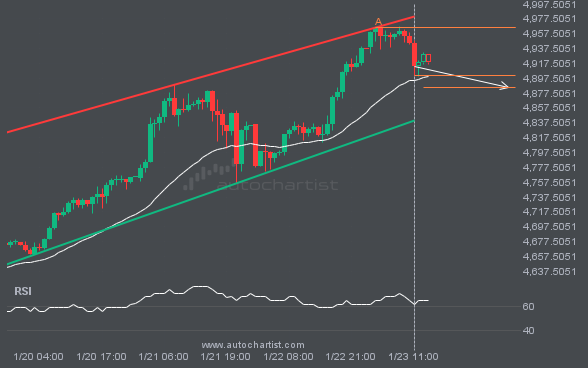
An emerging Channel Up pattern in its final wave has been identified on the XAUUSD 1 hour chart. After a strong bearish run, XAUUSD is heading toward the upper triangle trendline, with possible resistance at 4885.6165. If the support holds, the Channel Up pattern suggests a rebound toward current levels.
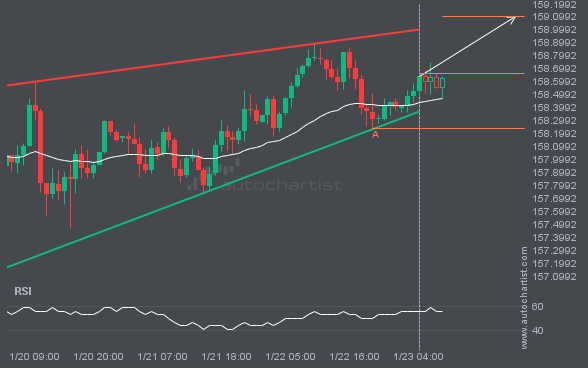
An emerging Rising Wedge pattern has been detected for USDJPY on the 1 hour chart. There may be a move toward 159.1024 in the next few candles. Once it reaches the resistance, it may continue its bullish run or revert to current price levels.
S&P500 is moving toward a resistance line. Since it has retraced from this line before, we may see either a breakout through it or a rebound to current levels. It has touched this line multiple times in the past 4 days and may test it again within the next 21 hours.
Autochartist provides an extensive analytics toolset with features to take your trading to the next level. Empower your day-to-day trading decisions with an unrivalled breadth and depth of analysis driven by advanced algorithms, powerful big-data technology, and user-friendly trading tools.

