 Skip to content
 FTSE100 is approaching a resistance line at 8772.7002. If it hits the resistance line, it may break through this level
Autochartist, a leading global provider of automated technical analysis tools, is proud to announce that it has been recognized as the #1 Trading Signals Technology Provider in the ForexBrokers.com 2025 Annual Awards. This accolade highlights Autochartist’s dedication to delivering cutting-edge broker solutions that empower traders worldwide. ForexBrokers.com, an authority in broker reviews and financial content, […]
LTCUSD is moving towards a resistance line. Because we have seen it retrace from this line before, we could see either a break through this line, or a rebound back to current levels. It has touched this line numerous times in the last 7 days and may test it again within the next 2 days.
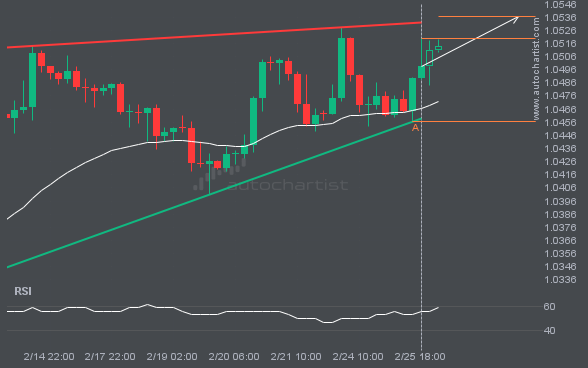
Emerging Rising Wedge detected on EURUSD – the pattern is an emerging one and has not yet broken through support, but the price is expected to move up over the next few hours. The price at the time the pattern was found was 1.05194 and it is expected to move to 1.0536.
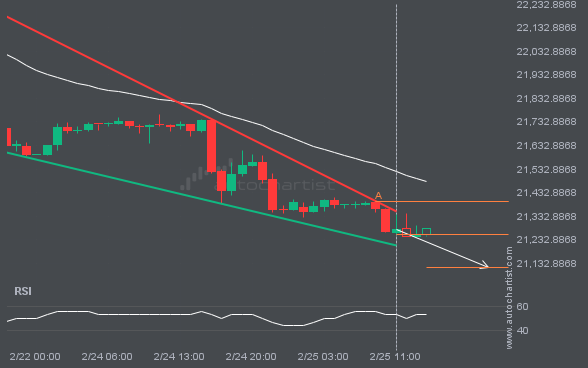
NAS100 is heading towards the support line of a Falling Wedge. If this movement continues, the price of NAS100 could test 21116.3138 within the next 8 hours. It has tested this line numerous times in the past, so this movement could be short-lived and end up rebounding just like it did in the past.
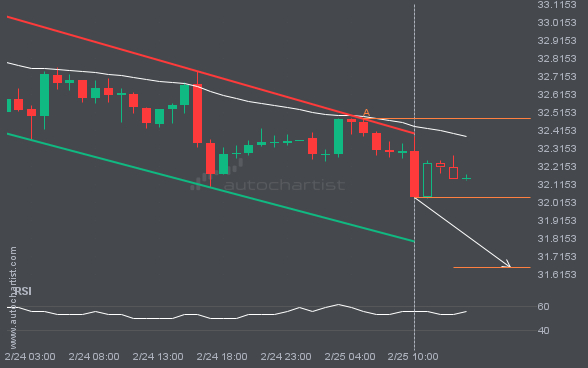
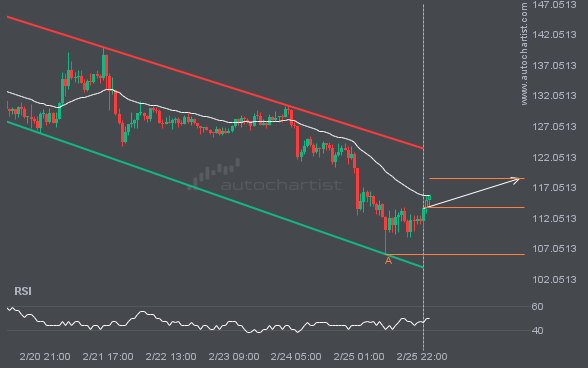
Emerging Channel Down detected on XAGUSD – the pattern is an emerging one and has not yet broken through resistance, but the price is expected to move up over the next few hours. The price at the time the pattern was found was 32.041 and it is expected to move to 31.6519.
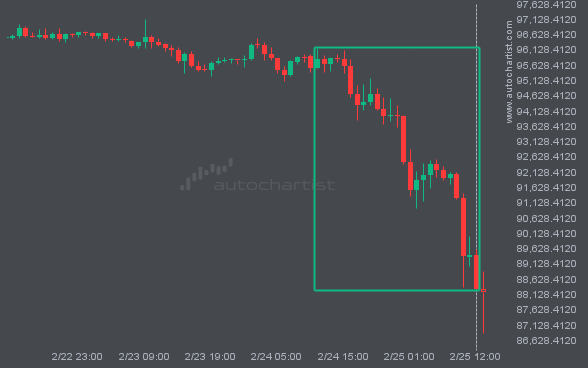
A movement of 7.84% over 2 days on BTCUSD doesn’t go unnoticed. You may start considering where it’s heading next, a continuation of the current downward trend, or a reversal in the previous direction.
Autochartist provides an extensive analytics toolset with features to take your trading to the next level. Empower your day-to-day trading decisions with an unrivalled breadth and depth of analysis driven by advanced algorithms, powerful big-data technology, and user-friendly trading tools.

