 Skip to content
 A movement of 4.71% over 18 hours on BTCUSD does not go unnoticed. You may want to consider where it
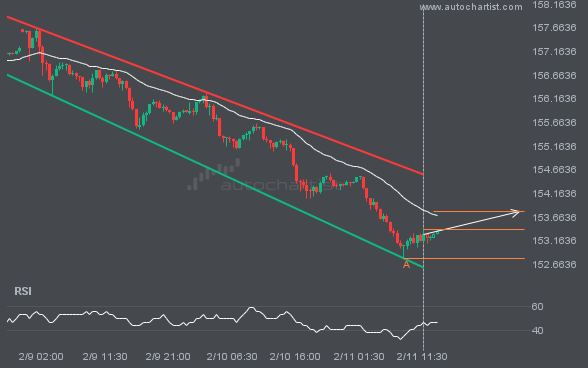
USDJPY is heading toward the resistance line of a Channel Down pattern and could reach it within the next 17 hours. It has tested this line numerous times before, and this time may be no different, ending in a rebound instead of a breakout. If a breakout doesn’t occur, we could see a retracement back […]
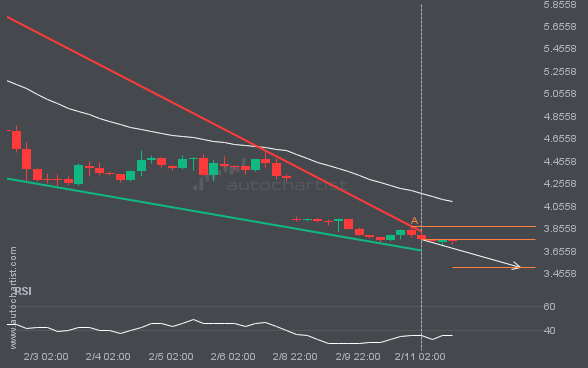
A Falling Wedge pattern was identified for NGC/USD at 3.7565, suggesting it may move toward the support line at 3.5119. It may break through that line and continue the bearish trend, or reverse from it.
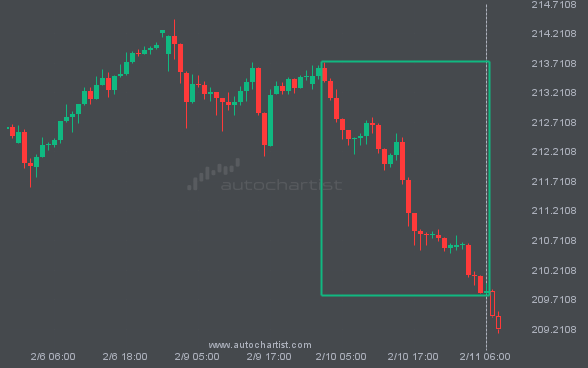
GBPJPY reached 209.8455 after a 1.67% move spanning 2 days.
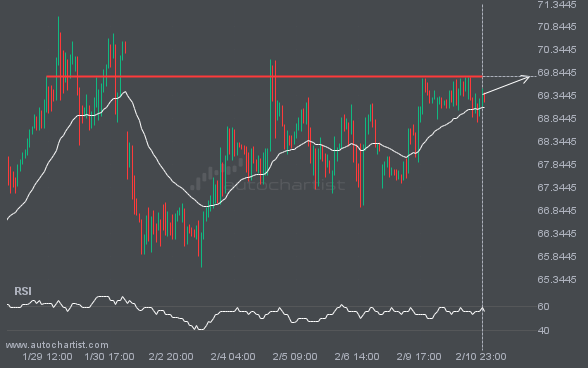
BRN/USD is approaching the line at 69.7610. If this move continues, the price of BRN/USD could test 69.7610 within the next 2 days. But do not rush to trade. It has tested this line many times in the past, so the move could be short-lived and end in a rebound.
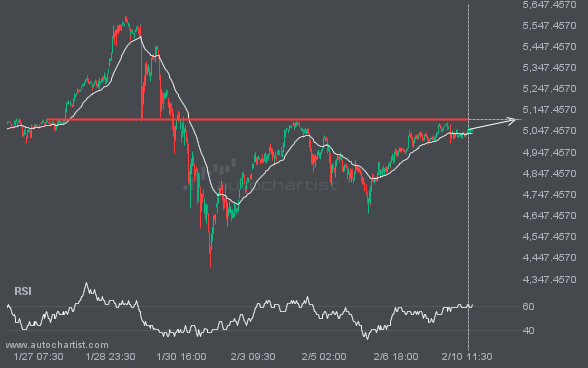
XAUUSD is moving toward a resistance line. Because it has retraced from this level in the past, we may see either a breakout through this line or a rebound to current levels. It has touched this line multiple times over the last 15 days and may test it again within the next 3 days.
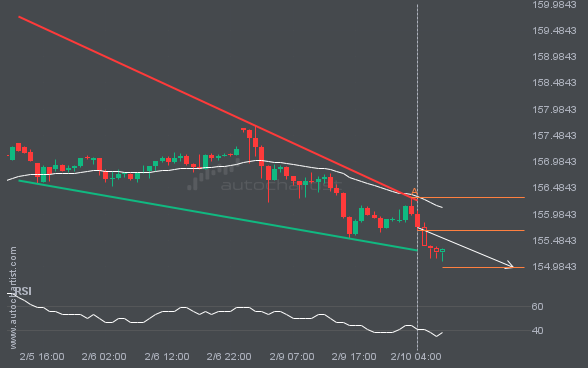
USDJPY is heading toward the support line of a Falling Wedge pattern and could reach it within the next 15 hours. It has tested this line numerous times before, and this time may be no different, ending in a rebound instead of a breakout. If a breakout doesn’t occur, we could see a retracement back […]
Autochartist provides an extensive analytics toolset with features to take your trading to the next level. Empower your day-to-day trading decisions with an unrivalled breadth and depth of analysis driven by advanced algorithms, powerful big-data technology, and user-friendly trading tools.

