 Skip to content
 NAS100 just posted a 2.55% move over the past 15 hours—a move unlikely to go unnoticed by any trading style.
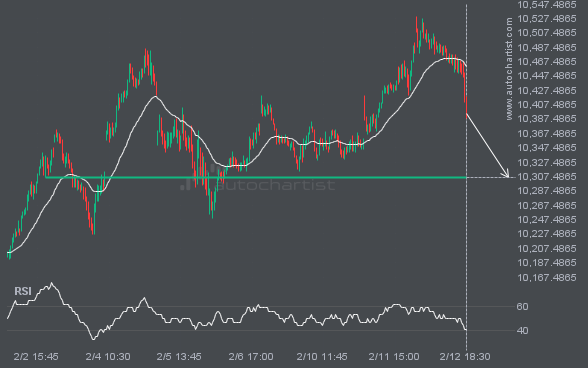
FTSE100 is heading toward 10305.5098 and could reach this level within the next 17 hours. It has tested this level numerous times in the past, and this time could be no different, ending in a rebound rather than a breakout. If a breakout does not occur, we may see a retracement back to current levels.
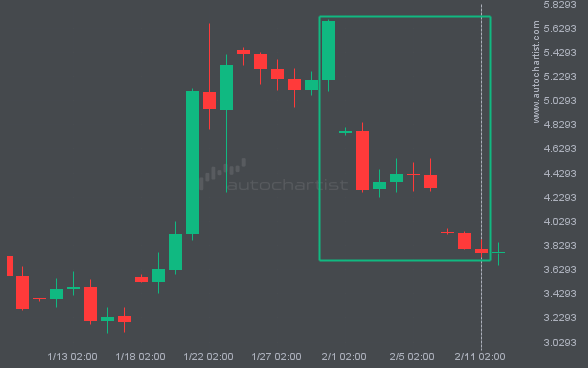
NGC/USD has moved lower by 33.83% from 5.686 to 3.7625 in the last 13 days.
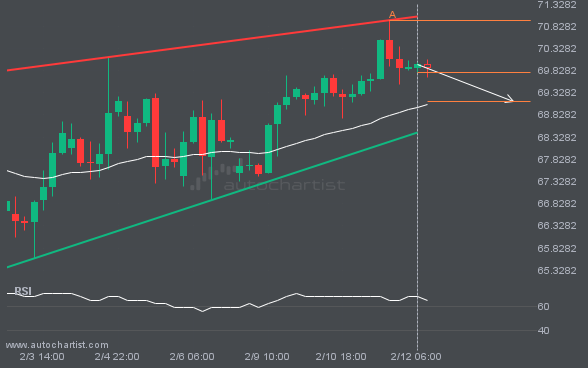
A Rising Wedge pattern was identified for BRN/USD at 69.774, suggesting it may move toward the support line at 69.1426. It may break through that line and continue the bearish trend, or reverse from it.
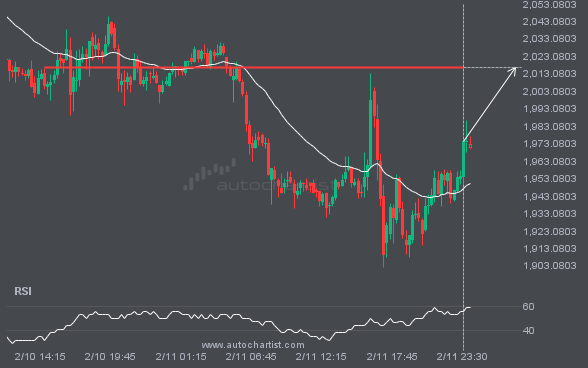
A strong resistance level has been identified at 2016.8300 on the 15 Minutes ETHUSD chart. ETHUSD is likely to test this level soon.
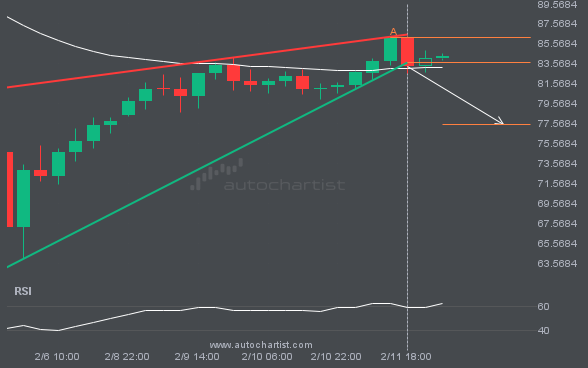
This trade setup on XAGUSD formed after a period of consolidation, during which the price moved mostly sideways before choosing a longer-term direction. Following the bearish breakout through support, the price could move toward 77.5370.
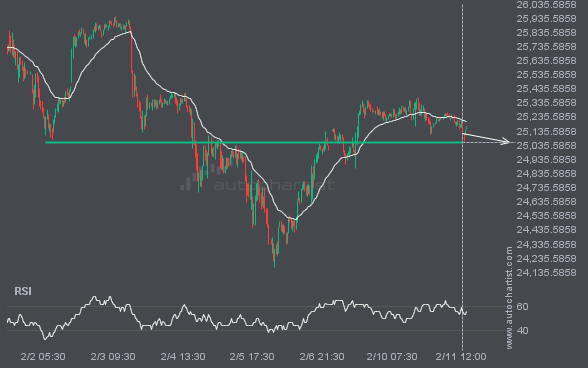
NAS100 is heading toward 25052.8320 and could reach this level within the next 2 days. It has tested this level numerous times in the past, and this time could be no different, ending in a rebound rather than a breakout. If a breakout does not occur, we may see a retracement back to current levels.
Autochartist provides an extensive analytics toolset with features to take your trading to the next level. Empower your day-to-day trading decisions with an unrivalled breadth and depth of analysis driven by advanced algorithms, powerful big-data technology, and user-friendly trading tools.

