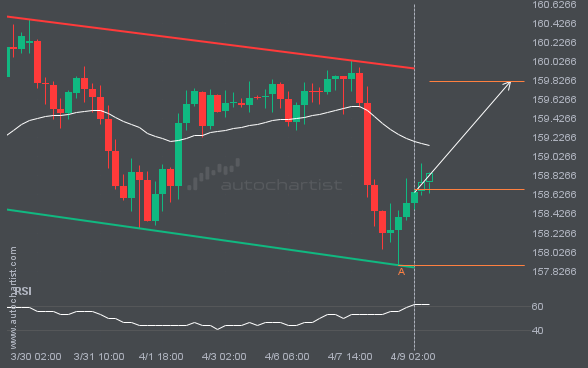
A Channel Down pattern was identified for USDJPY at 158.6825, suggesting it may move toward the resistance line at 159.8174. It may break through that line and continue the bullish trend, or reverse from it.
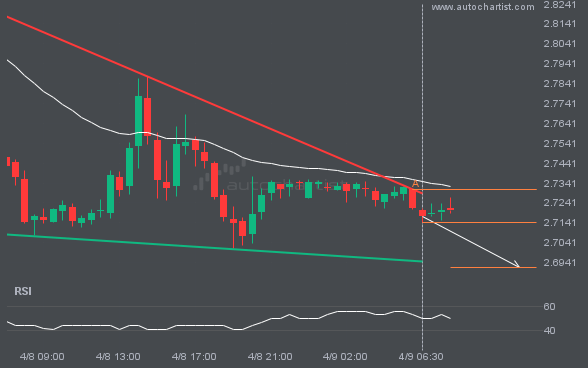
NGC/USD was identified around 2.714 after recently rebounding off the resistance on the 30 Minutes interval. Ultimately, the stock’s price action has formed a Falling Wedge pattern. This squeeze may increase the chances of a strong breakout. The projected move could take the price to around 2.6916.
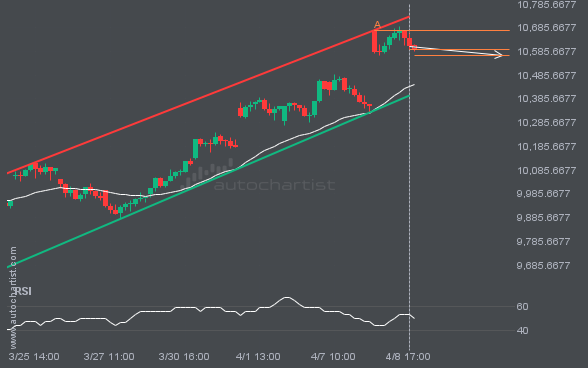
An emerging Channel Up pattern in its final wave has been identified on the FTSE100 1 hour chart. After a strong bearish run, FTSE100 is heading toward the upper triangle trendline, with possible resistance at 10570.0445. If the support holds, the Channel Up pattern suggests a rebound toward current levels.
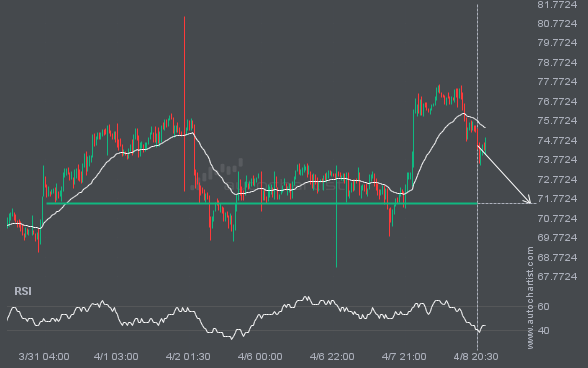
The price of XAGUSD is heading back toward the support area. It may struggle to break through and could reverse direction. The price may eventually break through, but it typically retreats from the level several times before doing so.
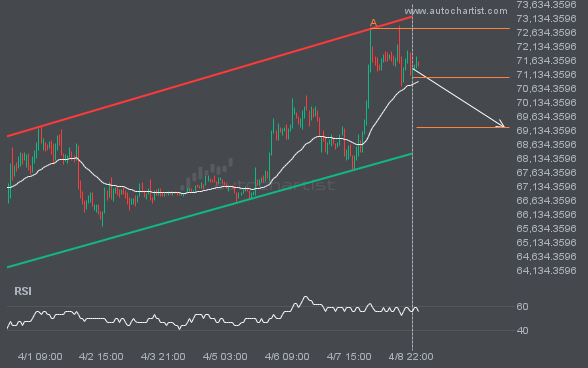
BTCUSD is heading toward the support line in a Channel Up pattern. If this move continues, the price of BTCUSD could test 69215.7152 within the next 3 days. It has tested this line many times before, so the move could be short-lived and may rebound as it has before.
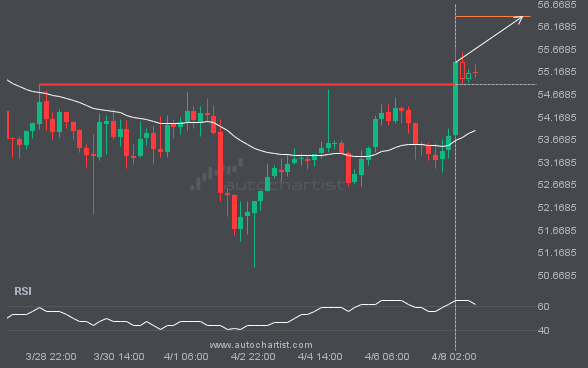
A strong resistance level has been breached at 54.8800 on the 4 hour LTCUSD chart. Technical analysis forecasts a move to 56.3910 within the next 2 days.
Enjoy Access to Premium Autochartist
Trading Tools - Sign Up and Explore for Free Now!
Autochartist provides an extensive analytics toolset with features to take your trading to the next level. Empower your day-to-day trading decisions with an unrivalled breadth and depth of analysis driven by advanced algorithms, powerful big-data technology, and user-friendly trading tools.