 Skip to content
 USDJPY is moving toward a key resistance level at 159.3210. This level has been tested before for USDJPY. This may
BTCUSD is moving toward a support line. Since it has retraced from this line before, we may see either a breakout through it or a rebound to current levels. It has touched this line multiple times in the past 12 days and may test it again within the next 3 days.

NGC/USD is moving toward a support line it has tested many times. It has retraced from this line before, so it’s unclear whether it will break through or rebound again. If NGC/USD continues on its current trajectory, it could reach 2.4976 within the next 3 days.
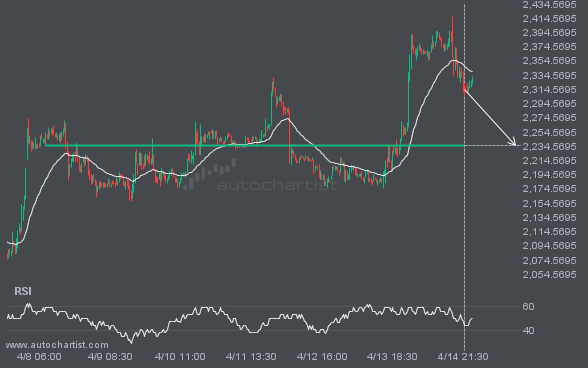
ETHUSD is moving toward a level at 2235.7000, which it has tested many times before. We have seen it retrace from this level before, so at this stage it isn’t clear whether it will break through this price or rebound again. If ETHUSD continues on its current trajectory, we may see it move toward 2235.7000 […]
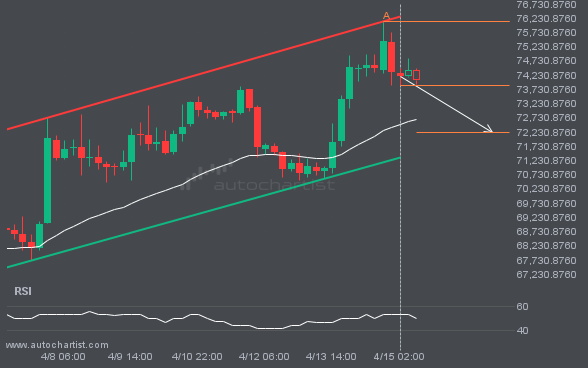
GBPJPY is moving toward a resistance line. Since it has retraced from this line before, we may see either a breakout through this line or a rebound to current levels. It has touched this line numerous times in the last 6 days and may test it again within the next 8 hours.
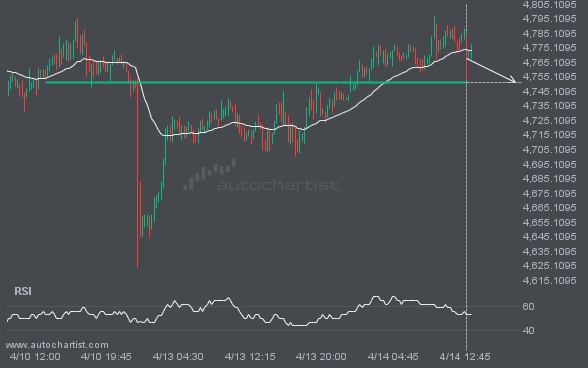
XAUUSD is moving toward a key support level at 4751.1050. This level has been tested before for XAUUSD. This may present a good trading opportunity either at the spot price or after a breakout through this level.
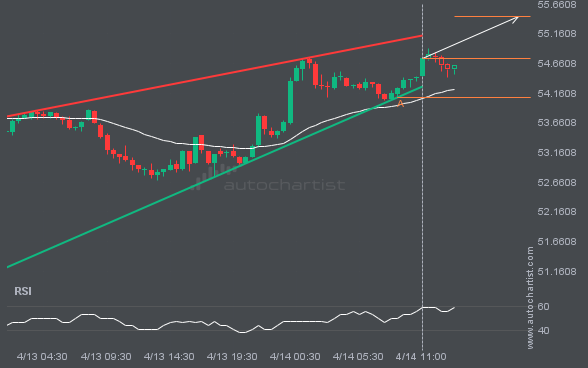
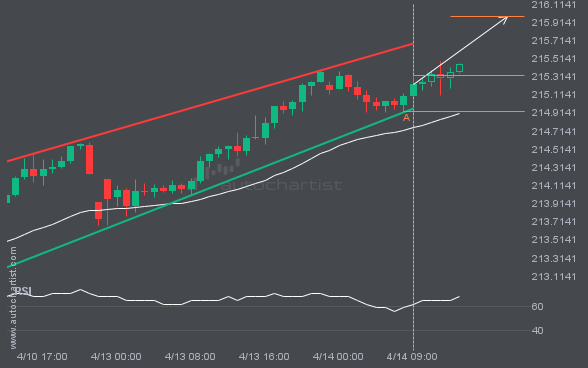
An emerging Rising Wedge has been detected on LTCUSD. The pattern has not yet broken through support, but the price is expected to move up over the next few hours. At the time the pattern was found, the price was 54.75, and it is expected to move to 55.4495.
Autochartist provides an extensive analytics toolset with features to take your trading to the next level. Empower your day-to-day trading decisions with an unrivalled breadth and depth of analysis driven by advanced algorithms, powerful big-data technology, and user-friendly trading tools.

