 Skip to content
 EURUSD has broken through the support line of a Rising Wedge pattern and suggests a possible move to 1.1784 within
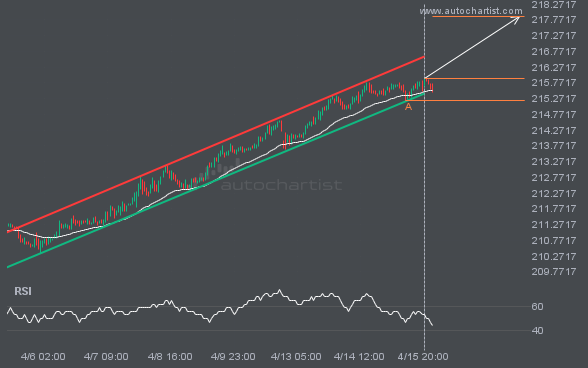
XAGUSD is moving toward a resistance line. Since it has retraced from this line before, we may see either a breakout through this line or a rebound to current levels. It has touched this line numerous times in the last 8 days and may test it again within the next 2 days.
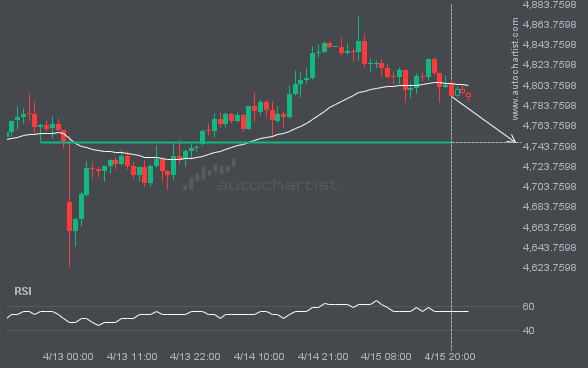
XAUUSD is approaching a support line at 4747.6250. If it hits the support line, it may break through this level to continue the bearish trend, or it may return to current levels.
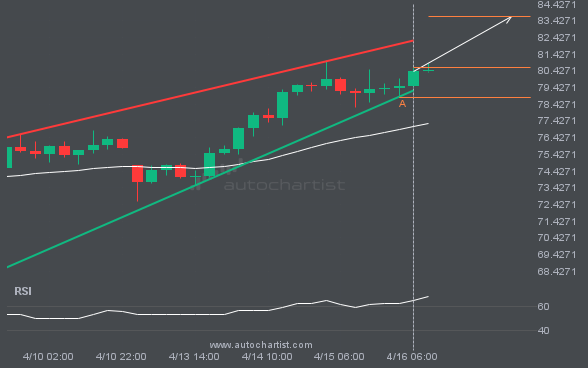
GBPJPY is moving toward a resistance line. Since it has retraced from this line before, we may see either a breakout through it or a rebound to current levels. It has touched this line multiple times in the past 13 days and may test it again within the next 3 days.
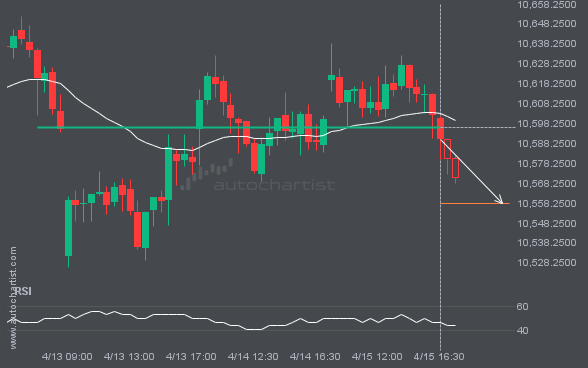
FTSE100 has broken through a support line. Because it has previously retraced from this price, you should wait for confirmation of the breakout before trading. It has touched this line multiple times over the past 6 days, which suggests a possible target around 10557.9355 within the next 5 hours.
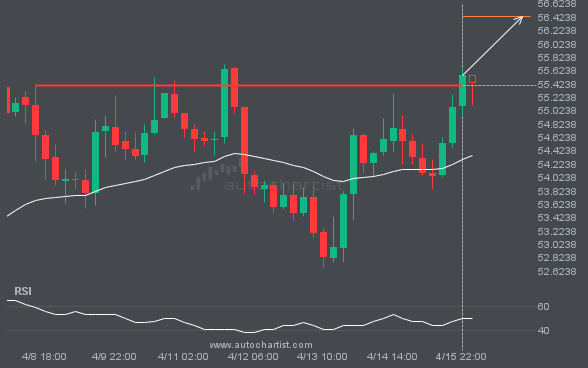
LTCUSD has broken through a resistance line. Because it has previously retraced from this price, you should wait for confirmation of the breakout before trading. It has touched this line multiple times over the past 8 days, which suggests a possible target around 56.4360 within the next 2 days.
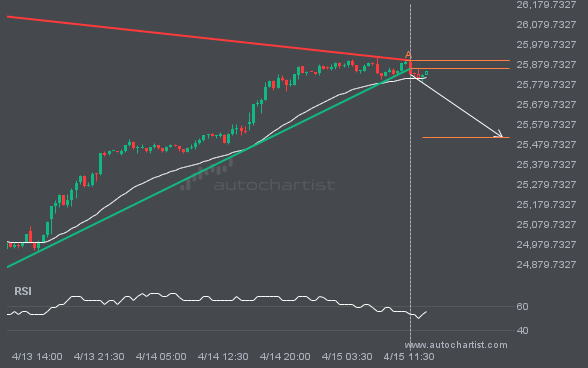
The last 5 30 Minutes candles on NAS100 have formed a Triangle pattern and broken out through the pattern lines, indicating a possible bearish movement toward the price level at 25512.7749.
Autochartist provides an extensive analytics toolset with features to take your trading to the next level. Empower your day-to-day trading decisions with an unrivalled breadth and depth of analysis driven by advanced algorithms, powerful big-data technology, and user-friendly trading tools.

