 Skip to content
 GBPJPY has broken through the support line which it has tested twice in the past. We have seen it retrace
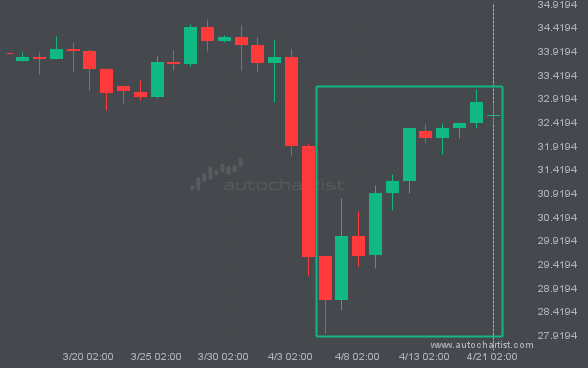
XAGUSD has experienced an extremely big movement in last 15 days. It may continue the trend, but this would make the move unprecedented in the recent past.
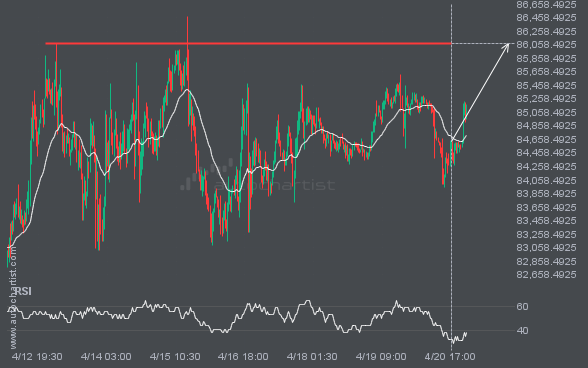
BTCUSD is moving towards a line of 86079.4688 which it has tested numerous times in the past. We have seen it retrace from this position in the past, so at this stage it isn’t clear whether it will breach this price or rebound as it did before. If BTCUSD continues in its current trajectory, we […]
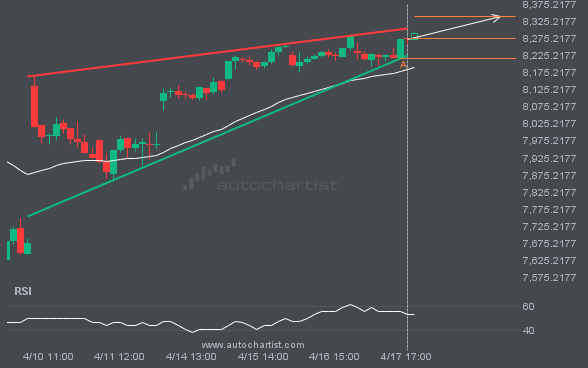
FTSE100 is approaching the resistance line of a Rising Wedge. It has touched this line numerous times in the last 9 days. If it tests this line again, it should do so in the next 16 hours.
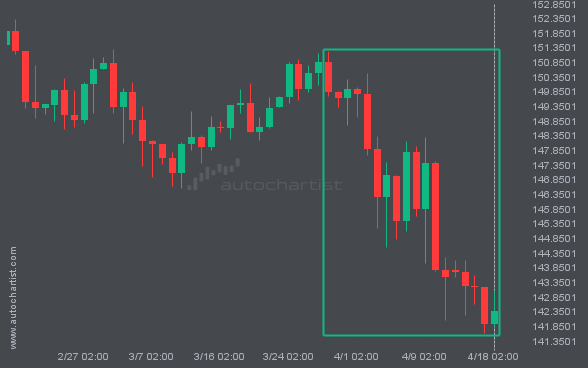
A movement of 4.99% over 22 days on USDJPY doesn’t go unnoticed. You may start considering where it’s heading next, a continuation of the current downward trend, or a reversal in the previous direction.
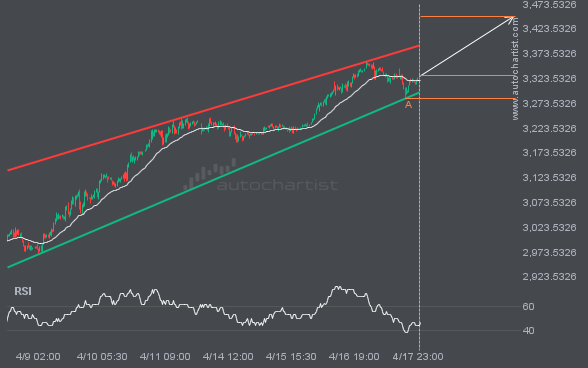
A Channel Up pattern was identified on XAUUSD at 3328.9805, creating an expectation that it may move to the resistance line at 3448.2418. It may break through that line and continue the bullish trend or it may reverse from that line.
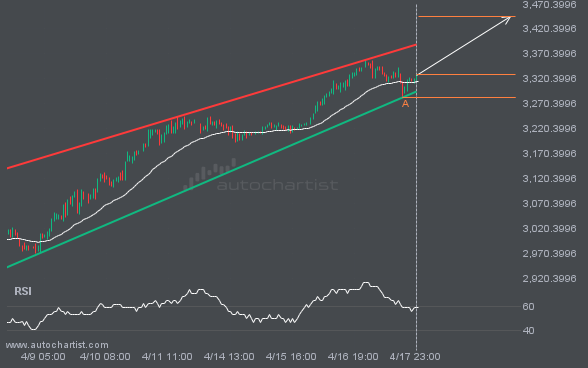
Emerging Channel Up detected on XAUUSD – the pattern is an emerging one and has not yet broken through support, but the price is expected to move up over the next few hours. The price at the time the pattern was found was 3328.9805 and it is expected to move to 3445.2853.
Autochartist provides an extensive analytics toolset with features to take your trading to the next level. Empower your day-to-day trading decisions with an unrivalled breadth and depth of analysis driven by advanced algorithms, powerful big-data technology, and user-friendly trading tools.

