 Skip to content
 BRN/USD is en route to a very important line that will be a definite deciding factor of what is to
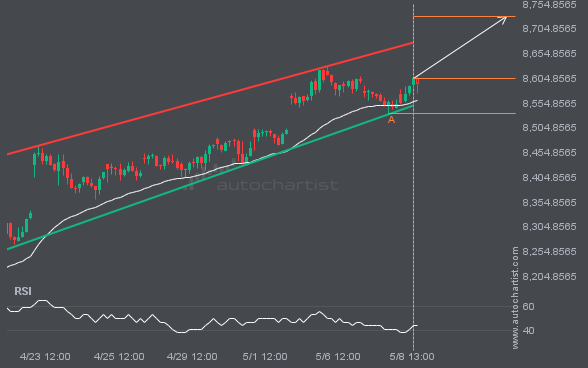
A Channel Up pattern was identified on FTSE100 at 8604.75, creating an expectation that it may move to the resistance line at 8729.5163. It may break through that line and continue the bullish trend or it may reverse from that line.
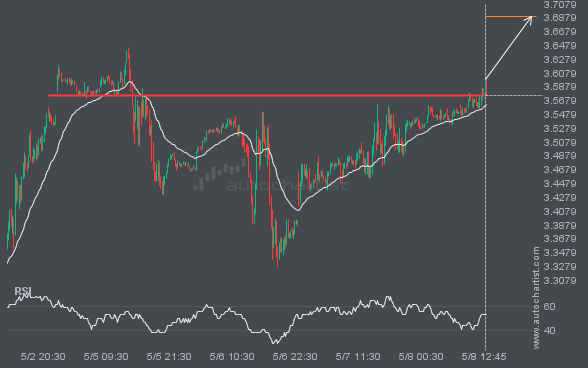
NGC/USD has broken through a line of 3.5755 and suggests a possible movement to 3.6897 within the next 20 hours. It has tested this line numerous times in the past, so one should wait for a confirmation of this breakout before taking any action. If the breakout doesn’t confirm, we could see a retracement back […]
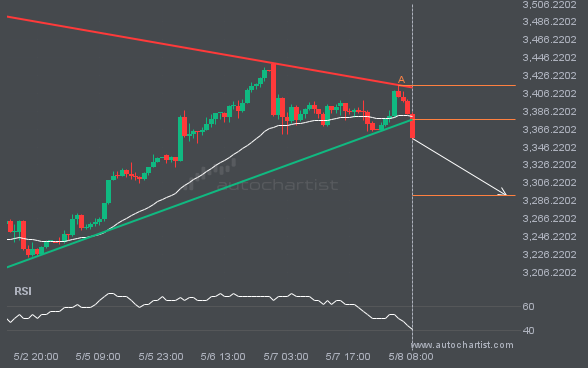
Triangle pattern identified on XAUUSD has broken through a support level with the price momentum continuing to move in an downward direction. A solid trading opportunity continues with the price expected to reach 3291.9738 in the next 2.
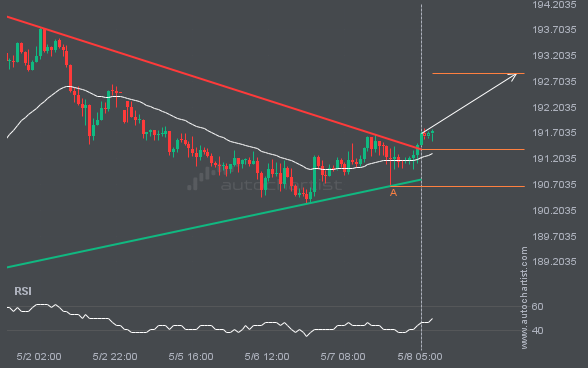
GBPJPY moved through the resistance line of a Triangle at 191.3827272727273 on the 1 hour chart. This line has been tested a number of times in the past and this breakout could mean an upcoming change from the current trend. It may continue in its current direction toward 192.8505.
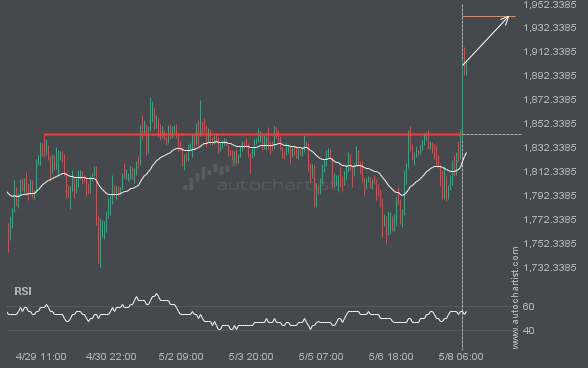
ETHUSD has breached the resistance line at 1843.4000. It may continue the bullish trend towards 1941.8719, or, it may prove to be yet another test of this level.
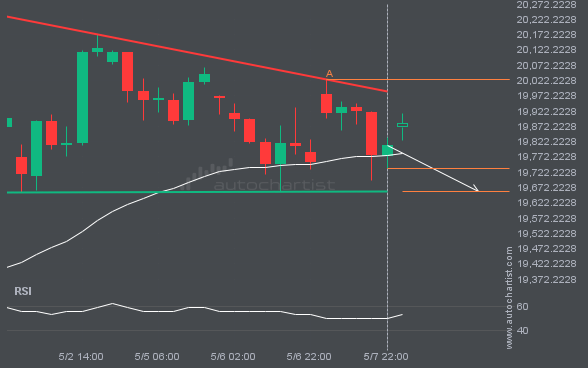
An emerging Descending Triangle has been detected on NAS100 on the 4 hour chart. There is a possible move towards 19659.0749 next few candles. Once reaching resistance it may continue its bearish run or reverse back to current price levels.
Autochartist provides an extensive analytics toolset with features to take your trading to the next level. Empower your day-to-day trading decisions with an unrivalled breadth and depth of analysis driven by advanced algorithms, powerful big-data technology, and user-friendly trading tools.

