 Skip to content
 BRN/USD just posted a 5.34% move over the past 2 days—a move unlikely to go unnoticed by any trading style.
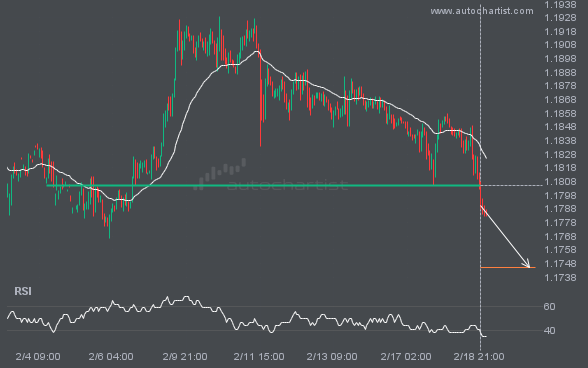
A strong support level has been breached at 1.1805 on the 1 hour EURUSD chart. Technical analysis forecasts a move to 1.1745 within the next 2 days.
LTCUSD is trapped in a Falling Wedge formation, implying that a breakout is imminent. This is a strong trade setup for both trend and swing traders. It is now approaching a resistance line that has been tested before. Divergence watchers may be optimistic about a potential breakout, which could mark the start of a new […]
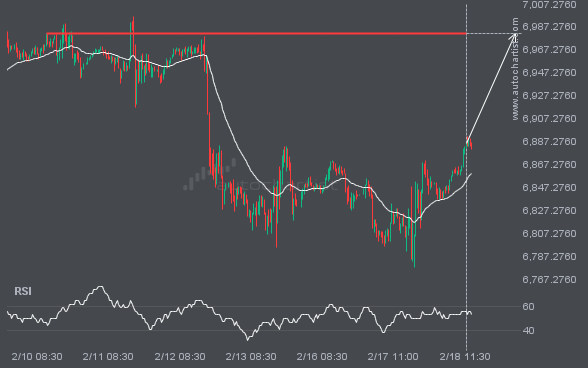
S&P500 is heading toward 6982.0000 and could reach this level within the next 2 days. It has tested this level numerous times in the past, and this time could be no different, ending in a rebound rather than a breakout. If a breakout does not occur, we may see a retracement back to current levels.
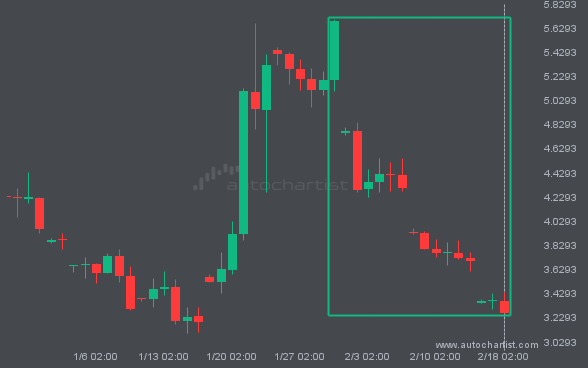
NGC/USD reached 3.2645 after a 42.59% move spanning 20 days.
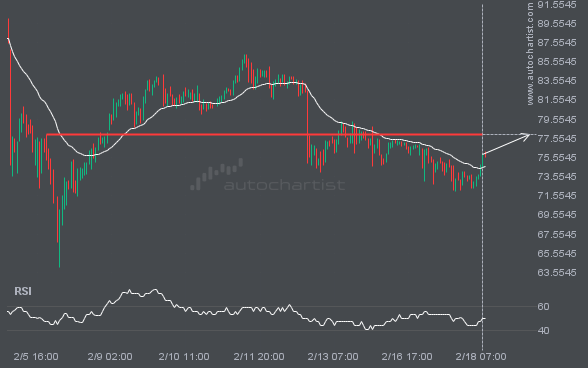
XAGUSD is moving toward a level at 77.8975, which it has tested many times before. We have seen it retrace from this level before, so at this stage it isn’t clear whether it will break through this price or rebound again. If XAGUSD continues on its current trajectory, we may see it move toward 77.8975 […]
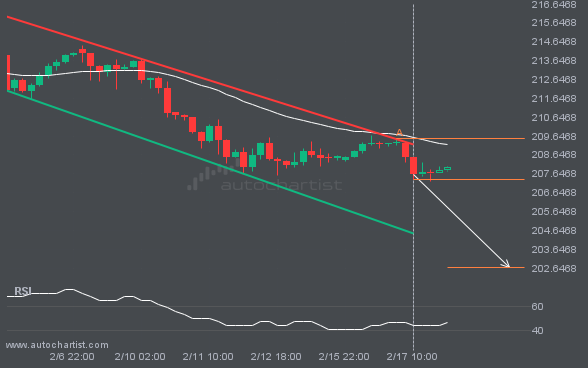
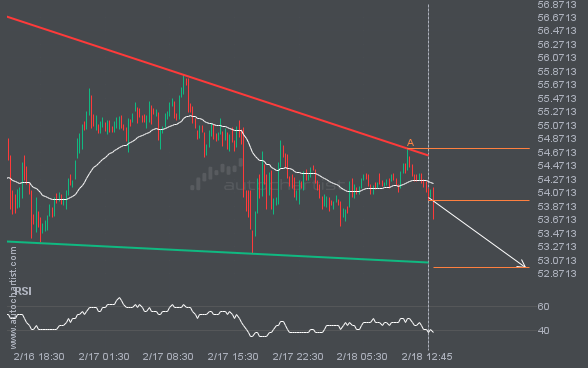
GBPJPY is moving toward a support line. Since it has retraced from this line before, we may see either a breakout through this line or a rebound to current levels. It has touched this line numerous times in the last 13 days and may test it again within the next 2 days.
Autochartist provides an extensive analytics toolset with features to take your trading to the next level. Empower your day-to-day trading decisions with an unrivalled breadth and depth of analysis driven by advanced algorithms, powerful big-data technology, and user-friendly trading tools.

