 Skip to content
 The last 8 4 hour candles on XAUUSD formed a Rising Wedge pattern and broken out through the pattern lines,
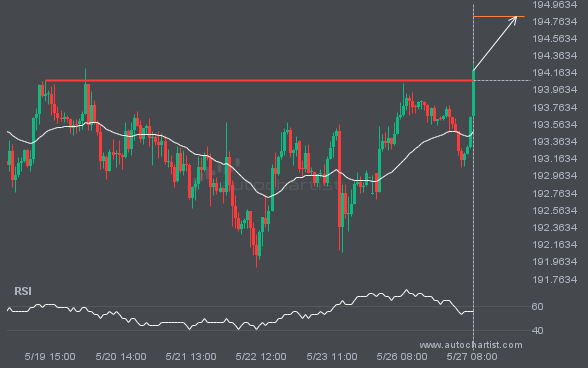
The breakout of GBPJPY through the 194.0700 price line is a breach of an important psychological price that is has tested numerous in the past. If this breakout persists, GBPJPY could test 194.8174 within the next 2 days. One should always be cautious before placing a trade, wait for confirmation of the breakout.
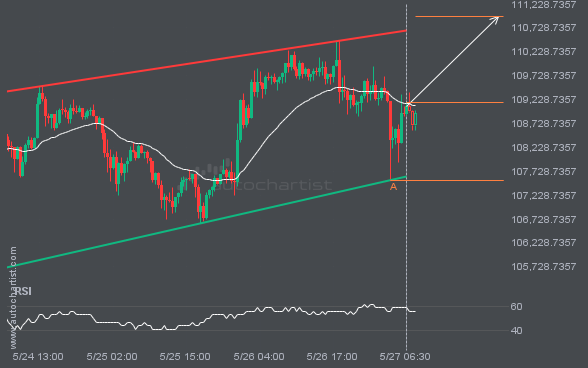
BTCUSD is approaching the resistance line of a Channel Up. It has touched this line numerous times in the last 4 days. If it tests this line again, it should do so in the next 19 hours.
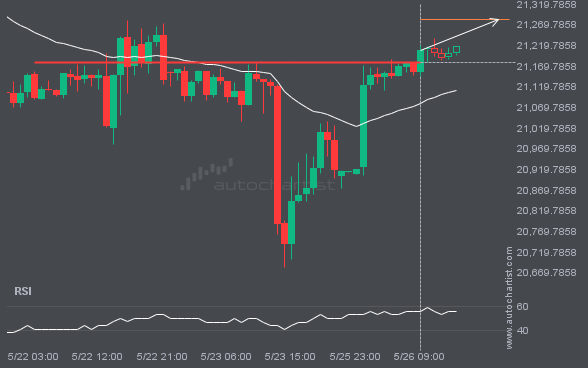
A strong resistance level has been breached at 21178.3555 on the 1 hour NAS100 chart. Technical Analysis theory forecasts a movement to 21282.5684 in the next 8 hours.
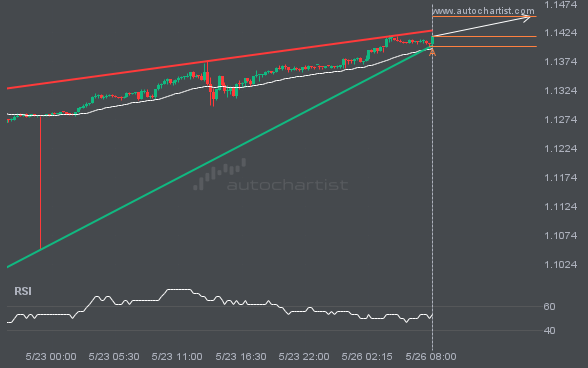
EURUSD is trapped in a Rising Wedge formation, implying that a breakout is Imminent. This is a great trade-setup for both trend and swing traders. It is now approaching a support line that has been tested in the past. Divergence opportunists may be very optimistic about a possible breakout and this may be the start […]
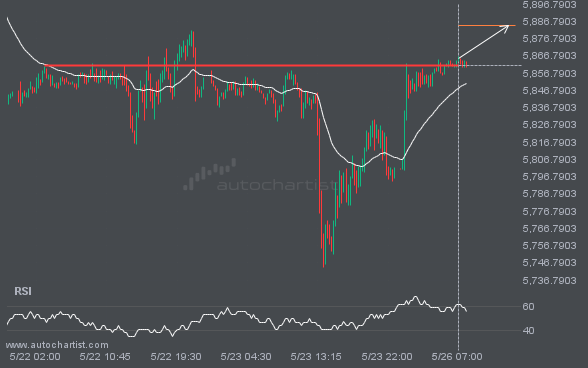
The breakout of S&P500 through the 5861.2402 price line is a breach of an important psychological price that is has tested numerous in the past. If this breakout persists, S&P500 could test 5884.4248 within the next 11 hours. One should always be cautious before placing a trade, wait for confirmation of the breakout.
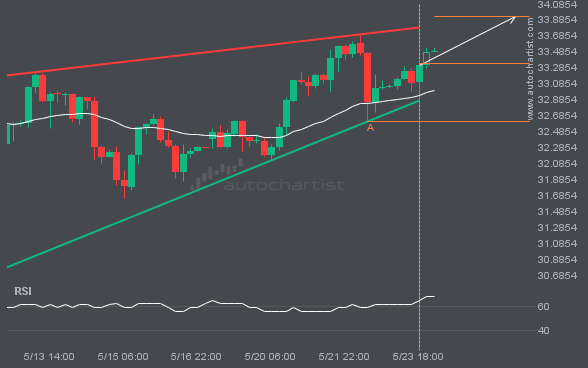
An emerging Rising Wedge has been detected on XAGUSD on the 4 hour chart. There is a possible move towards 33.9280 next few candles. Once reaching support it may continue its bullish run or reverse back to current price levels.
Autochartist provides an extensive analytics toolset with features to take your trading to the next level. Empower your day-to-day trading decisions with an unrivalled breadth and depth of analysis driven by advanced algorithms, powerful big-data technology, and user-friendly trading tools.

