 Skip to content
 XAGUSD was identified at around 35.816 having recently rebounded of the support on the 1 hour data interval. Ultimately, the
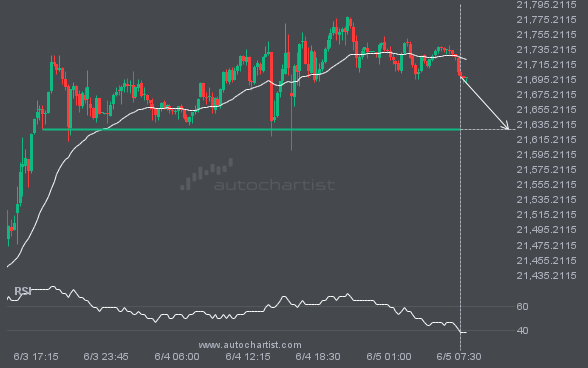
NAS100 is approaching a support line at 21628.4473. If it hits the support line, it may break through this level to continue the bearish trend, or it may turn around back to current levels.
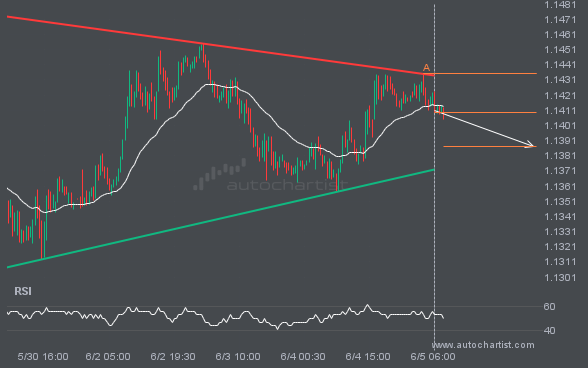
An emerging Triangle has been detected on EURUSD on the 30 Minutes chart. There is a possible move towards 1.1387 next few candles. Once reaching resistance it may continue its bearish run or reverse back to current price levels.
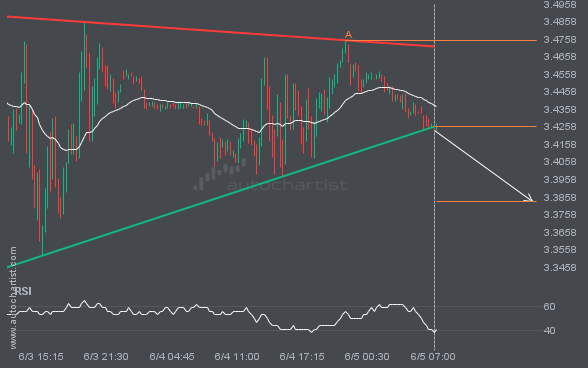
NGC/USD has broken through a support line. It has touched this line at least twice in the last 3 days. This breakout may indicate a potential move to 3.3833 within the next 12 hours. Because we have seen it retrace from this position in the past, one should wait for confirmation of the breakout before […]
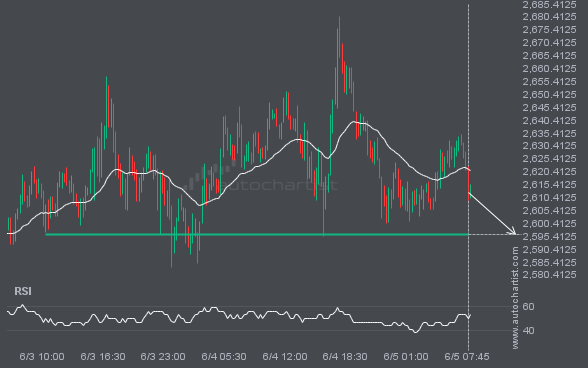
ETHUSD is approaching a support line at 2596.0300. If it hits the support line, it may break through this level to continue the bearish trend, or it may turn around back to current levels.
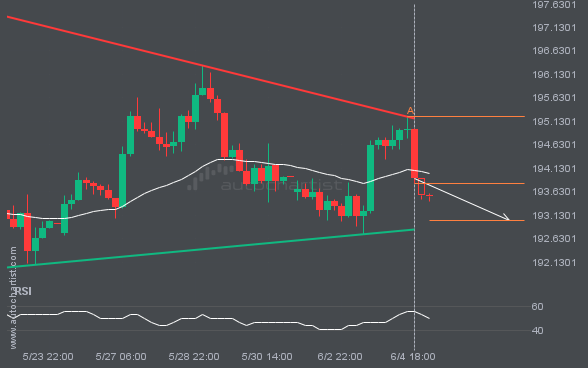
GBPJPY is heading towards the support line of a Triangle and could reach this point within the next 3 days. It has tested this line numerous times in the past, and this time could be no different from the past, ending in a rebound instead of a breakout. If the breakout doesn’t happen, we could […]
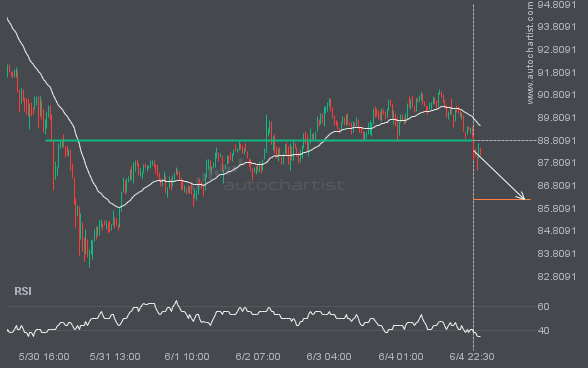
LTCUSD has broken through 88.8100 which it has tested numerous times in the past. We have seen it retrace from this price in the past. If this new trend persists, LTCUSD may be heading towards 86.2090 within the next 2 days.
Autochartist provides an extensive analytics toolset with features to take your trading to the next level. Empower your day-to-day trading decisions with an unrivalled breadth and depth of analysis driven by advanced algorithms, powerful big-data technology, and user-friendly trading tools.

