 Skip to content
 GBPJPY is approaching the support line of a Falling Wedge. It has touched this line numerous times in the last
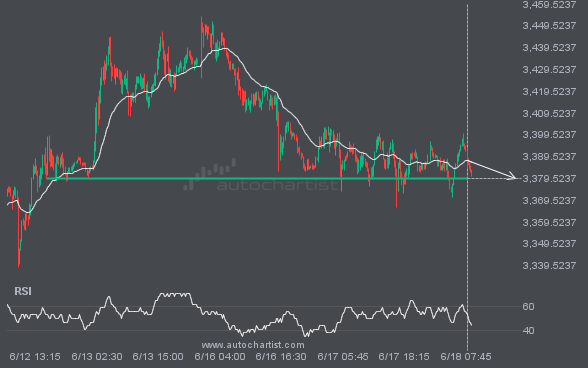
LTCUSD is approaching the support line of a Descending Triangle. It has touched this line numerous times in the last 15 days. If it tests this line again, it should do so in the next 3 days.
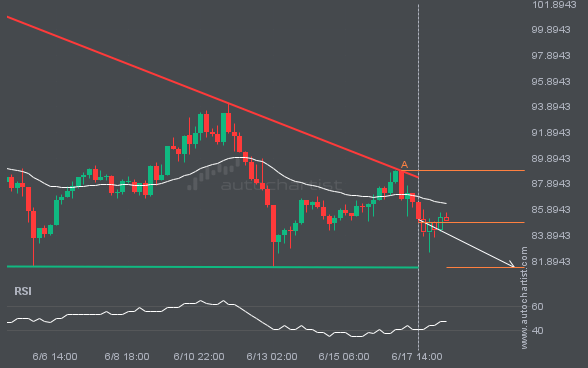
XAUUSD is moving towards a support line. Because we have seen it retrace from this level in the past, we could see either a break through this line, or a rebound back to current levels. It has touched this line numerous times in the last 6 days and may test it again within the next […]
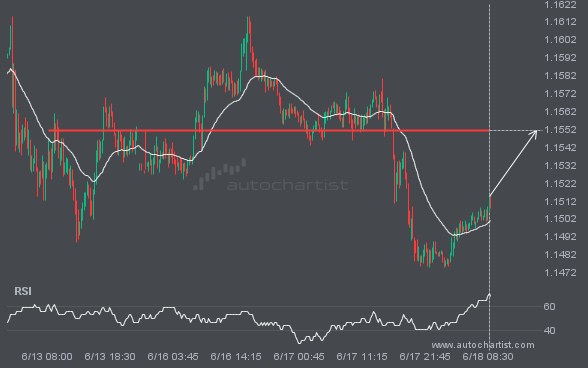
EURUSD is approaching a resistance line at 1.1551. If it hits the resistance line, it may break through this level to continue the bullish trend, or it may turn around back to current levels.
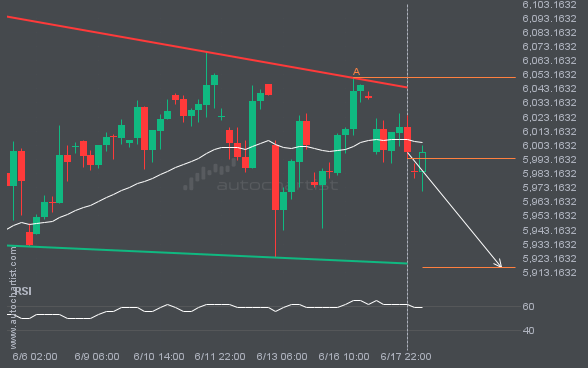
Emerging Descending Triangle detected on S&P500 – the pattern is an emerging one and has not yet broken through resistance, but the price is expected to move up over the next few hours. The price at the time the pattern was found was 5994.16 and it is expected to move to 5916.7489.
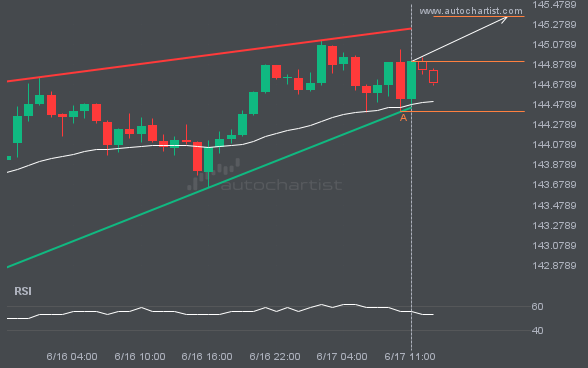
A Rising Wedge pattern was identified on USDJPY at 144.9045, creating an expectation that it may move to the resistance line at 145.3541. It may break through that line and continue the bullish trend or it may reverse from that line.
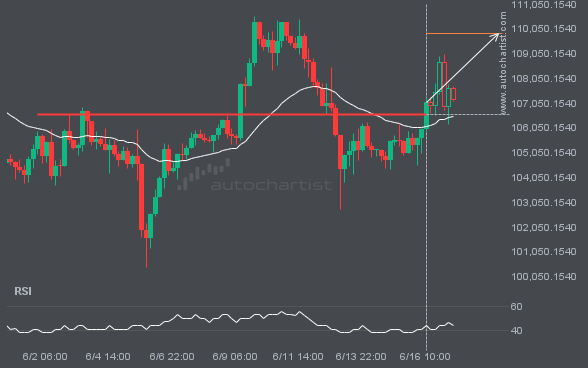
The breakout of BTCUSD through the 106573.0313 price line is a breach of an important psychological price that is has tested numerous in the past. If this breakout persists, BTCUSD could test 109867.4688 within the next 3 days. One should always be cautious before placing a trade, wait for confirmation of the breakout.
Autochartist provides an extensive analytics toolset with features to take your trading to the next level. Empower your day-to-day trading decisions with an unrivalled breadth and depth of analysis driven by advanced algorithms, powerful big-data technology, and user-friendly trading tools.

