 Skip to content
 XAUUSD is heading towards the resistance line of a Rising Wedge and could reach this point within the next 2
The movement of FTSE100 towards the resistance line of a Rising Wedge is yet another test of the line it reached numerous times in the past. This line test could happen in the next 11 hours, but it is uncertain whether it will result in a breakout through this line, or simply rebound back to […]
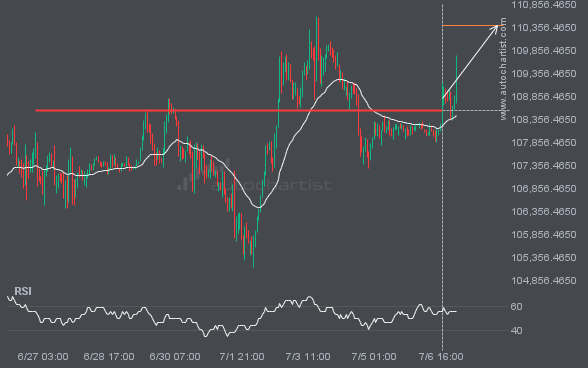
BTCUSD is once again retesting a key horizontal resistance level at 108538.3594. It has tested this level 5 times in the recent past and could simply bounce off like it did last time. However, after this many tries, maybe it’s ready to start a new trend.
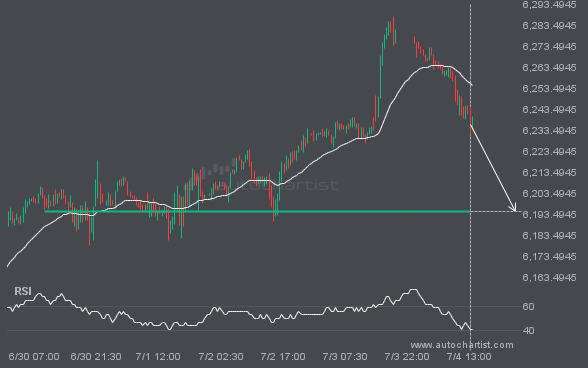
S&P500 is heading towards 6194.8799 and could reach this point within the next 2 days. It has tested this line numerous times in the past, and this time could be no different, ending in a rebound instead of a breakout. If the breakout doesn’t happen, we could see a retracement back down to current levels.
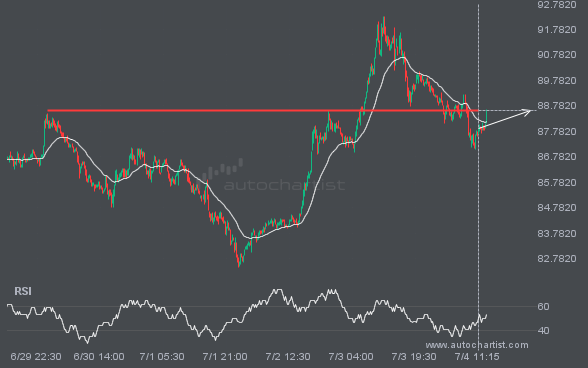
A strong resistance level has been identified at 88.6100 on the 15 Minutes LTCUSD chart. LTCUSD is likely to test it soon.
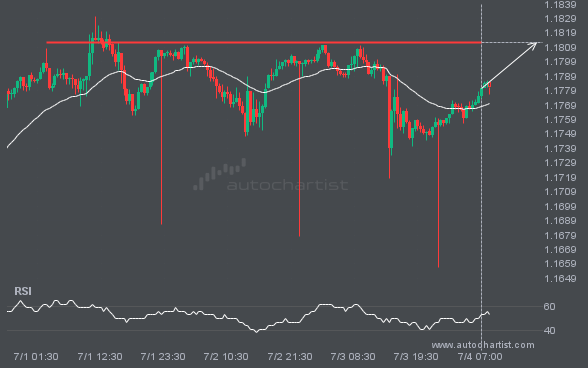
EURUSD is heading towards a line of 1.1812. If this movement continues, the price of EURUSD could test 1.1812 within the next 17 hours. But don’t be so quick to trade, it has tested this line numerous times in the past, so this movement could be short-lived and end up rebounding.
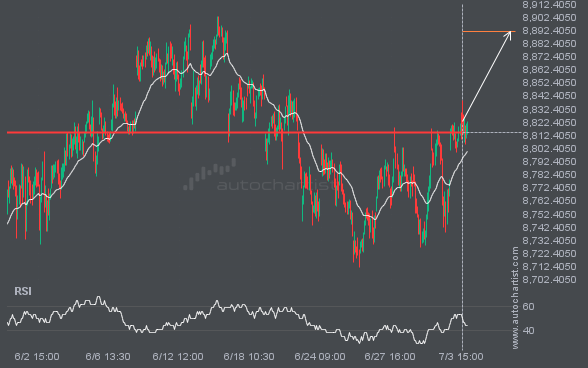
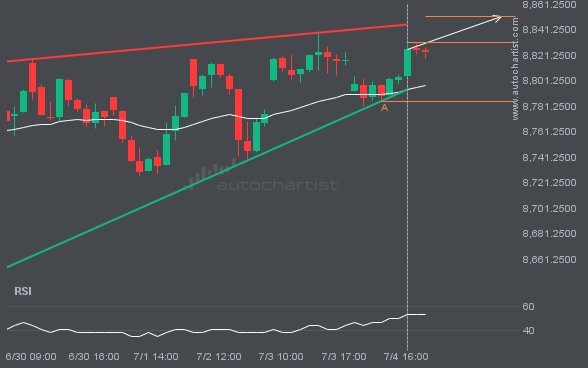
FTSE100 has broken through 8814.3701 which it has tested numerous times in the past. We have seen it retrace from this price in the past. If this new trend persists, FTSE100 may be heading towards 8891.3789 within the next 3 days.
Autochartist provides an extensive analytics toolset with features to take your trading to the next level. Empower your day-to-day trading decisions with an unrivalled breadth and depth of analysis driven by advanced algorithms, powerful big-data technology, and user-friendly trading tools.

