 Skip to content
 FTSE100 is heading towards the support line of a Channel Up. If this movement continues, the price of FTSE100 could
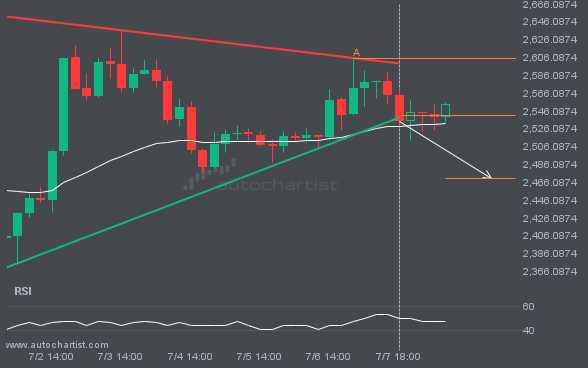
The breakout of ETHUSD through the support line of a Triangle could be a sign of the road ahead. If this breakout persists, we may see the price of ETHUSD testing 2470.4852 within the next 2 days.

An emerging Rising Wedge has been detected on XAUUSD on the 4 hour chart. There is a possible move towards 3380.8507 next few candles. Once reaching support it may continue its bullish run or reverse back to current price levels.
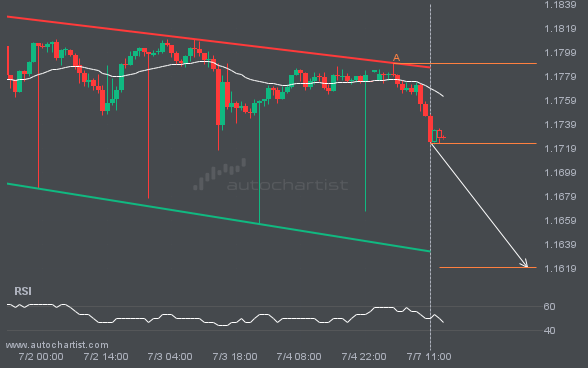
EURUSD was identified at around 1.172335 having recently rebounded of the resistance on the 1 hour data interval. Ultimately, the price action of the stock has formed a Channel Down pattern. This squeeze may increases the chances of a strong breakout. The projected movement will potentially take the price to around the 1.1620 level.
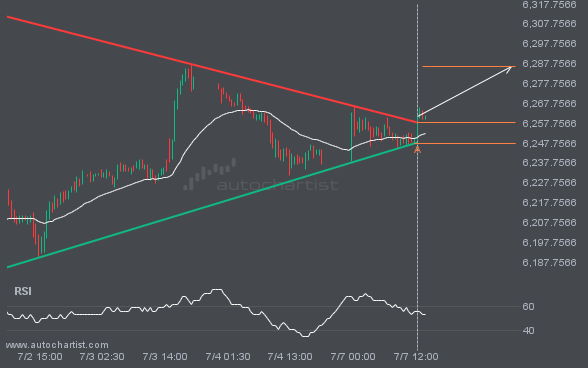
S&P500 moved through the resistance line of a Triangle at 6258.341666666667 on the 30 Minutes chart. This line has been tested a number of times in the past and this breakout could mean an upcoming change from the current trend. It may continue in its current direction toward 6286.2379.
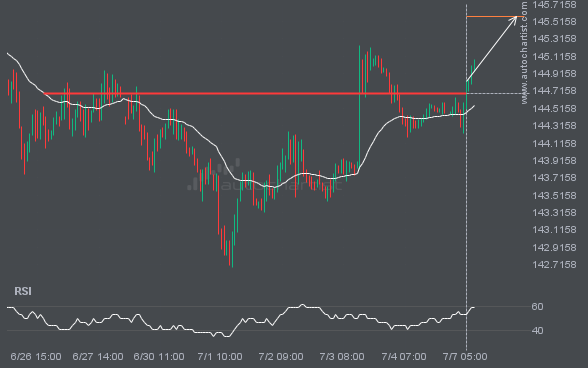
The price of USDJPY in heading in the direction of 145.5714. Despite the recent breakout through 144.6825 it is possible that it will struggle to gain momentum to the forecast price and move back in the other direction. This has happened many times in the past so watch for a possible bounce back.
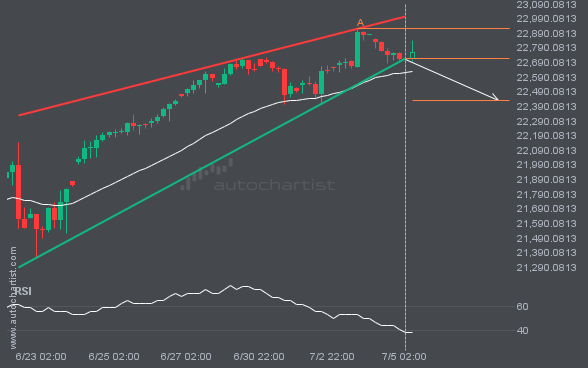
NAS100 has broken through a support line of a Rising Wedge and suggests a possible movement to 22427.7359 within the next 23 hours. It has tested this line in the past, so one should probably wait for a confirmation of this breakout before taking action. If the breakout doesn’t confirm, we could see a retracement […]
Autochartist provides an extensive analytics toolset with features to take your trading to the next level. Empower your day-to-day trading decisions with an unrivalled breadth and depth of analysis driven by advanced algorithms, powerful big-data technology, and user-friendly trading tools.

