 Skip to content
 A movement of 5.77% over 3 days on XAGUSD doesn’t go unnoticed. You may start considering where it’s heading next,
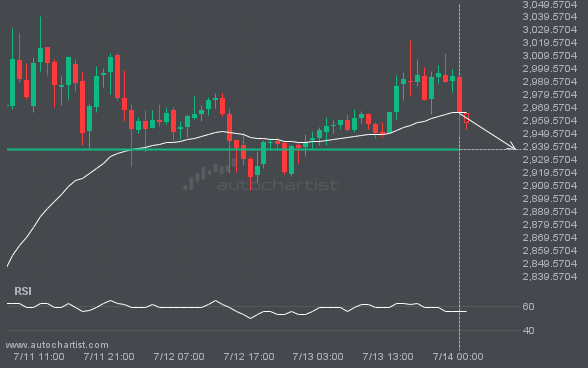
ETHUSD is moving towards a key support level at 2937.4099. This is a previously tested level for ETHUSD. This could be a good trading opportunity, either at the spot price, or after breaching this level.
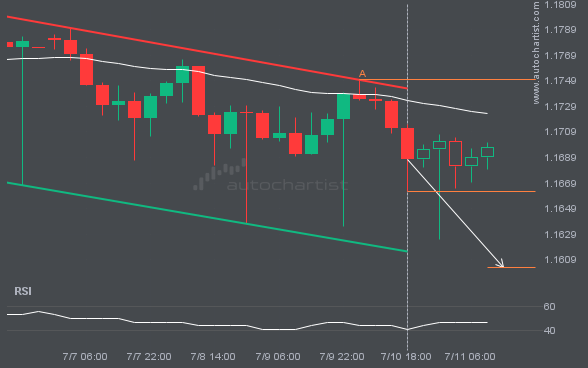
EURUSD is moving towards a support line. Because we have seen it retrace from this line before, we could see either a break through this line, or a rebound back to current levels. It has touched this line numerous times in the last 8 days and may test it again within the next 8 hours.
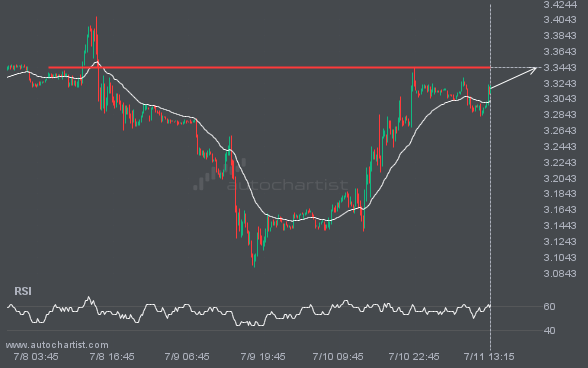
NGC/USD is about to retest a key horizontal resistance level near 3.3440. It has tested this level 5 times in the recent past and could simply bounce off like it did last time. However, after this many tries, maybe it’s ready to start a new trend.
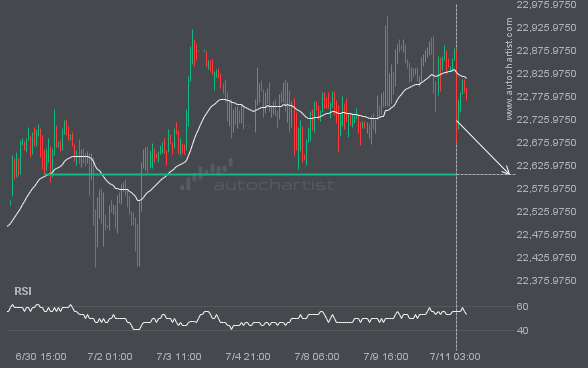
The price of NAS100 in heading back to the support area. It is possible that it will struggle to break through it and move back in the other direction. The price may eventually break through, but typically the price retreats from the level a number of times before doing so.
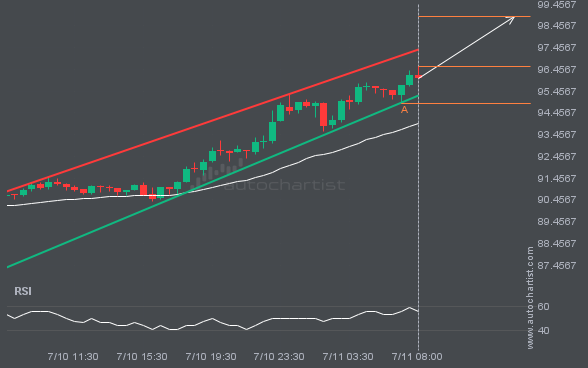
Emerging Channel Up pattern in its final wave was identified on the LTCUSD 30 Minutes chart. After a strong bullish run, we find LTCUSD heading towards the upper triangle line with a possible resistance at 98.8800. If the resistance shows to hold, the Channel Up pattern suggests a rebound back towards current levels.
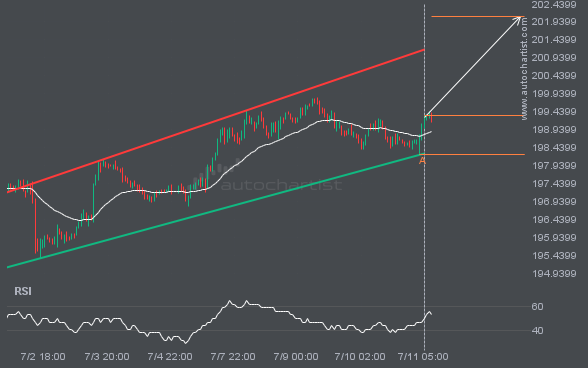
GBPJPY is moving towards a resistance line which it has tested numerous times in the past. We have seen it retrace from this line before, so at this stage it isn’t clear whether it will breach this line or rebound as it did before. If GBPJPY continues in its current trajectory, we could see it […]
Autochartist provides an extensive analytics toolset with features to take your trading to the next level. Empower your day-to-day trading decisions with an unrivalled breadth and depth of analysis driven by advanced algorithms, powerful big-data technology, and user-friendly trading tools.

