 Skip to content
 The price of GBPJPY in heading in the direction of 200.6473. Despite the recent breakout through 199.0315 it is possible
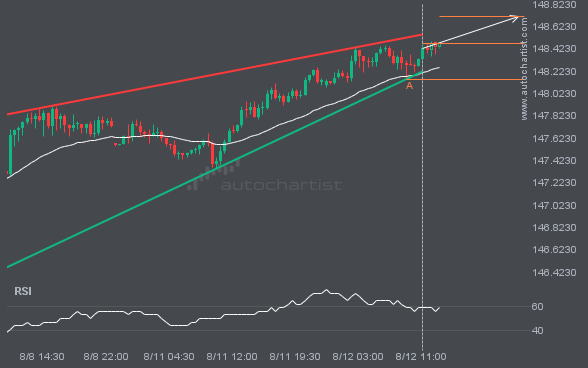
USDJPY is approaching the resistance line of a Rising Wedge. It has touched this line numerous times in the last 5 days. If it tests this line again, it should do so in the next 12 hours.
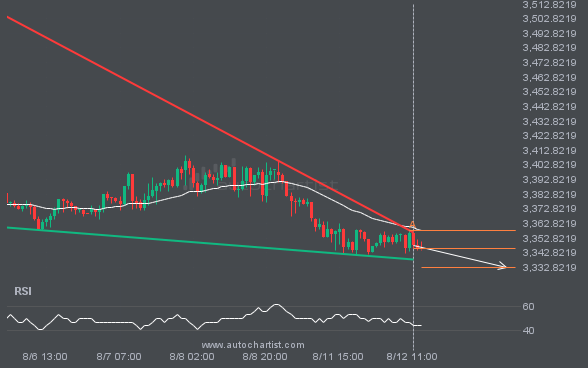
An emerging Falling Wedge has been detected on XAUUSD on the 1 hour chart. There is a possible move towards 3332.6967 next few candles. Once reaching resistance it may continue its bearish run or reverse back to current price levels.
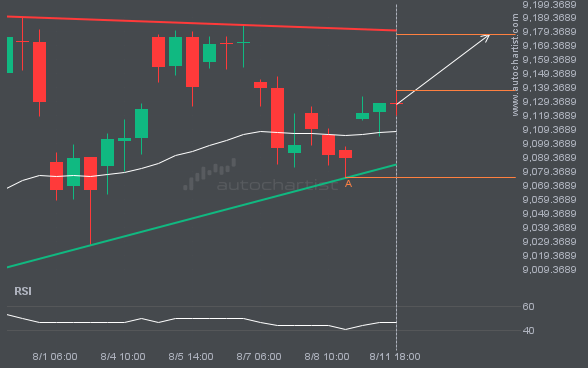
FTSE100 is approaching the resistance line of a Ascending Triangle. It has touched this line numerous times in the last 15 days. If it tests this line again, it should do so in the next 2 days.
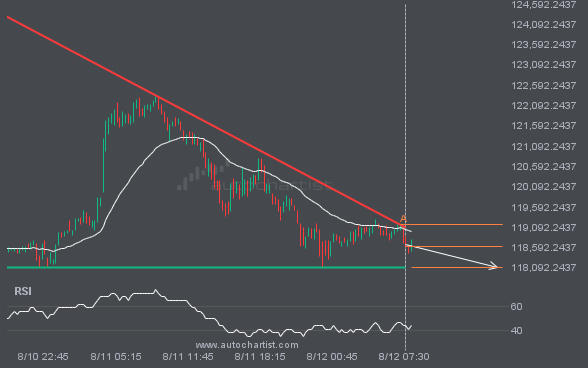
BTCUSD is heading towards the support line of a Descending Triangle and could reach this point within the next 10 hours. It has tested this line numerous times in the past, and this time could be no different from the past, ending in a rebound instead of a breakout. If the breakout doesn’t happen, we […]
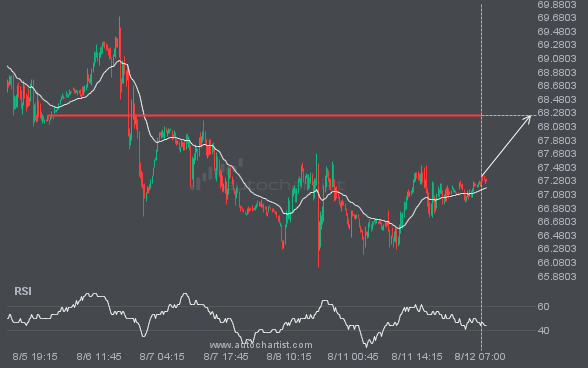
BRN/USD is heading towards 68.2385 and could reach this point within the next 22 hours. It has tested this line numerous times in the past, and this time could be no different, ending in a rebound instead of a breakout. If the breakout doesn’t happen, we could see a retracement back down to current levels.
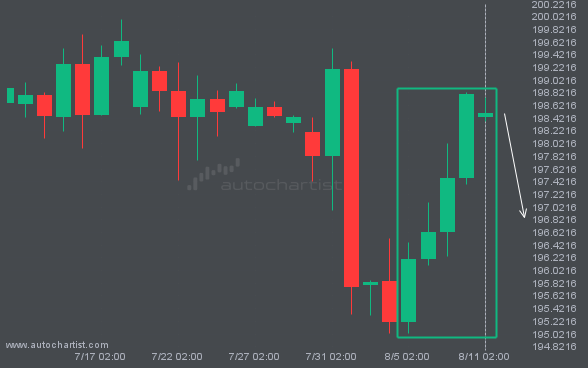
After posting 6 consecutive bullish candles in 7 days, you may start considering where GBPJPY is heading next, a continuation of the current upward trend, or a reversal in the previous direction.
Autochartist provides an extensive analytics toolset with features to take your trading to the next level. Empower your day-to-day trading decisions with an unrivalled breadth and depth of analysis driven by advanced algorithms, powerful big-data technology, and user-friendly trading tools.

