 Skip to content
 XAUUSD is heading toward the resistance line in a Rising Wedge pattern. If this move continues, the price of XAUUSD
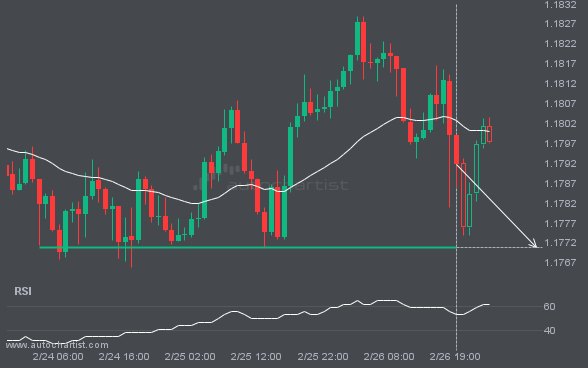
EURUSD is moving toward a support line. Because it has retraced from this level in the past, we may see either a breakout through this line or a rebound to current levels. It has touched this line multiple times over the last 3 days and may test it again within the next 10 hours.
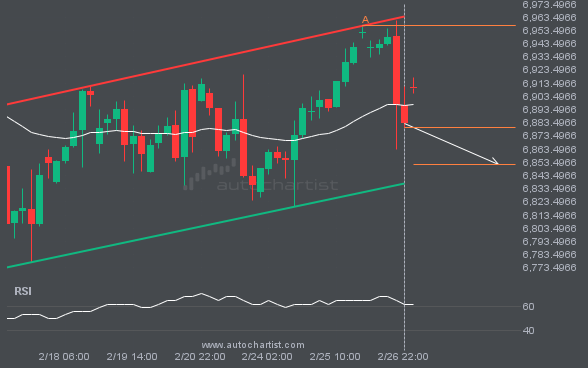
S&P500 is moving toward a support line. Since it has retraced from this line before, we may see either a breakout through this line or a rebound to current levels. It has touched this line numerous times in the last 16 days and may test it again within the next 3 days.
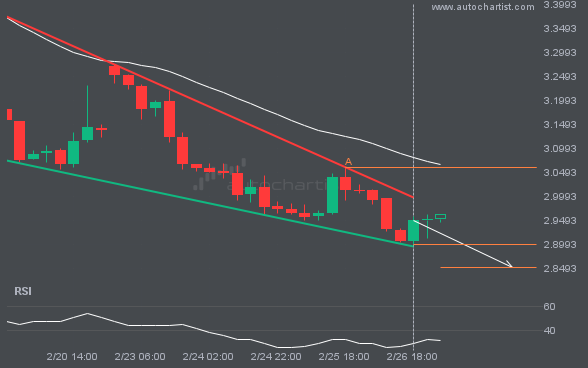
A Falling Wedge pattern was identified for NGC/USD at 2.8995, suggesting it may move toward the support line at 2.8510. It may break through that line and continue the bearish trend, or reverse from it.
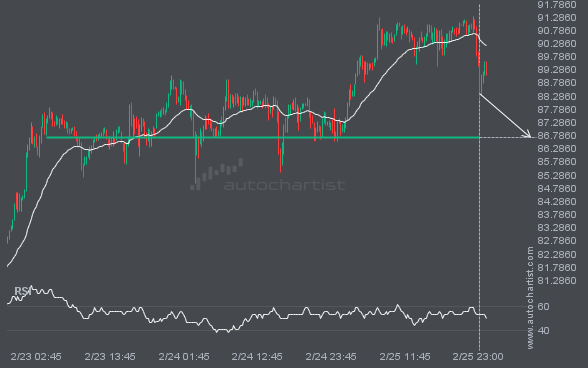
XAGUSD is approaching a support line at 86.7077. If it hits the support line, it may break through this level to continue the bearish trend, or it may return to current levels.
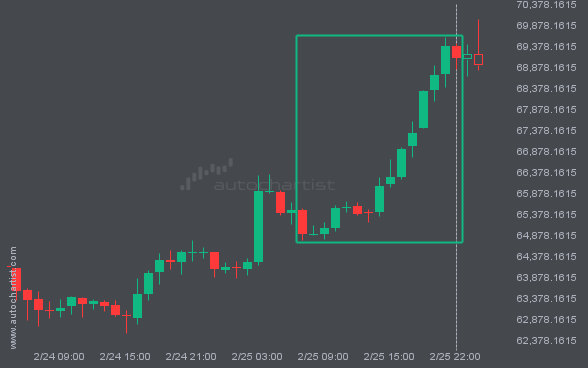
BTCUSD has moved higher by 6.44% from 64904.06 to 69080.89 in the last 15 hours.
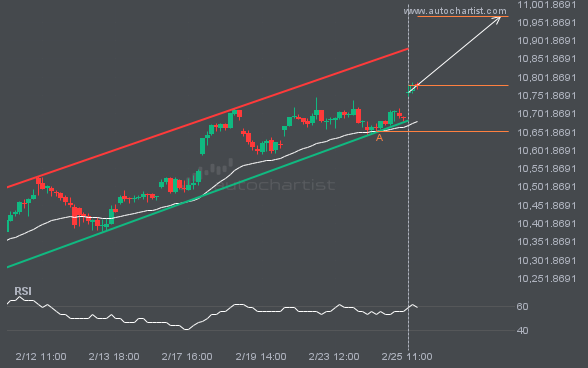
FTSE100 is moving toward a resistance line it has tested many times. It has retraced from this line before, so it’s unclear whether it will break through or rebound again. If FTSE100 continues on its current trajectory, it could reach 10967.5713 within the next 2 days.
Autochartist provides an extensive analytics toolset with features to take your trading to the next level. Empower your day-to-day trading decisions with an unrivalled breadth and depth of analysis driven by advanced algorithms, powerful big-data technology, and user-friendly trading tools.

