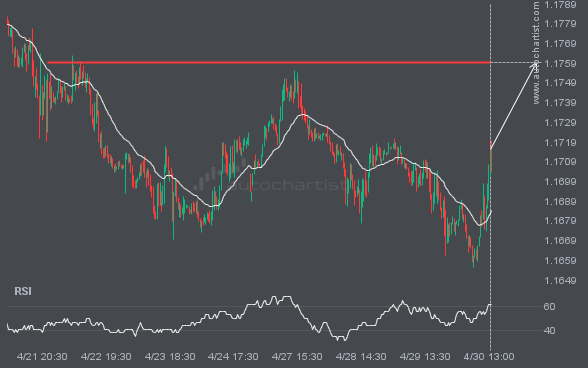
EURUSD is moving toward a key resistance level at 1.1759. This level has been tested before for EURUSD. This may present a good trading opportunity either at the spot price or after a breakout through this level.
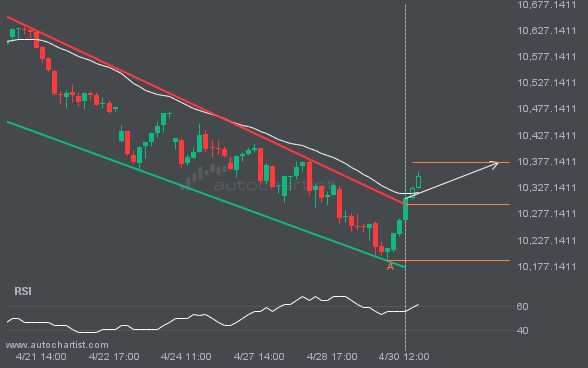
The last 11 1 hour candles on FTSE100 have formed a Channel Down pattern and broken out through the pattern lines, indicating a possible bullish movement toward the price level at 10374.8401.
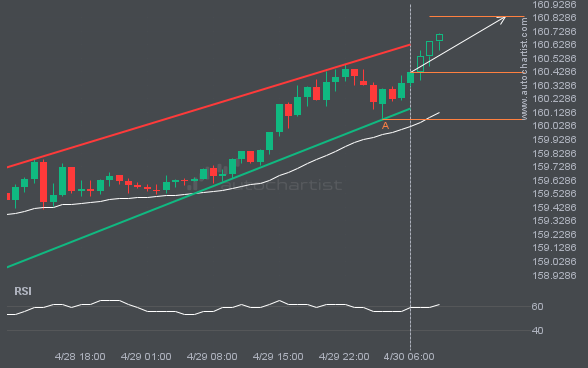
A Channel Up pattern was identified for USDJPY at 160.426, suggesting it may move toward the resistance line at 160.8360. It may break through that line and continue the bullish trend, or reverse from it.
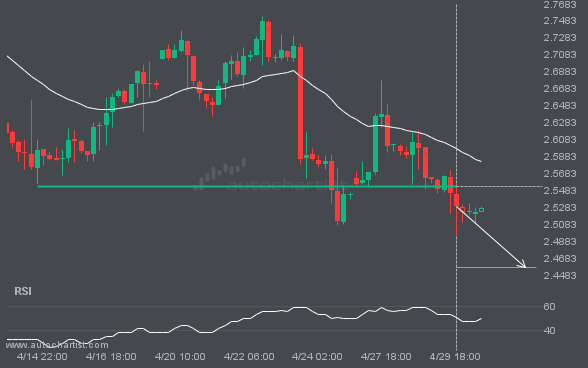
NGC/USD has broken through a level at 2.5535, suggesting a possible move to 2.4575 within the next 3 days. It has tested this level numerous times in the past, so you should wait for confirmation of this breakout before taking any action. If the breakout does not confirm, we could see a retracement back to […]
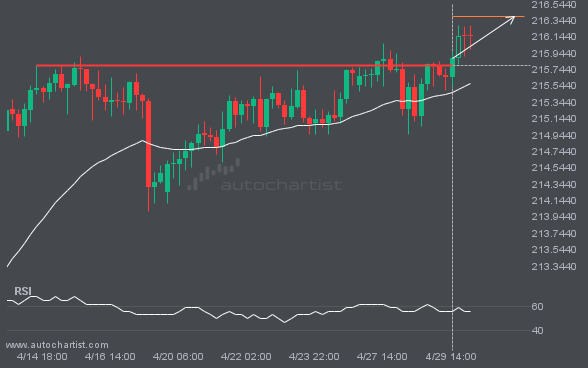
GBPJPY has broken through a resistance line. Because it has previously retraced from this price, you should wait for confirmation of the breakout before trading. It has touched this line multiple times over the past 16 days, which suggests a possible target around 216.3907 within the next 3 days.
Enjoy Access to Premium Autochartist
Trading Tools - Sign Up and Explore for Free Now!
Autochartist provides an extensive analytics toolset with features to take your trading to the next level. Empower your day-to-day trading decisions with an unrivalled breadth and depth of analysis driven by advanced algorithms, powerful big-data technology, and user-friendly trading tools.