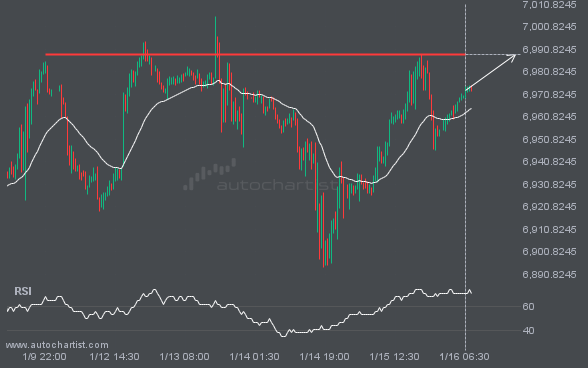
S&P500 is moving toward a key resistance level at 6988.4102. This level has been tested before for S&P500. This may present a good trading opportunity either at the spot price or after a breakout through this level.
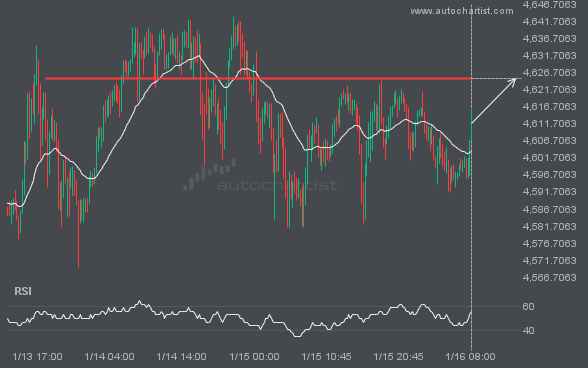
XAUUSD is moving toward a key resistance level at 4624.8950. This level has been tested before for XAUUSD. This may present a good trading opportunity either at the spot price or after a breakout through this level.
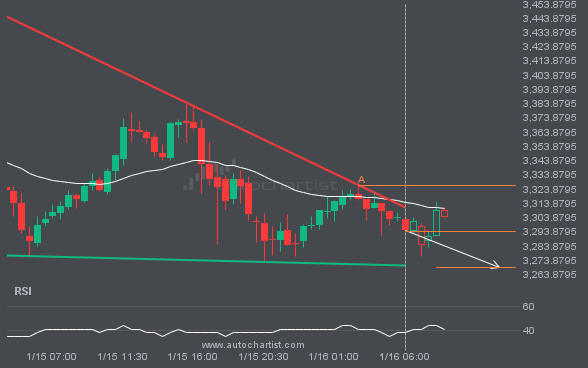
An emerging Descending Triangle pattern in its final wave has been identified on the ETHUSD 30 Minutes chart. After a strong bearish run, ETHUSD is heading toward the upper triangle trendline, with possible resistance at 3268.9400. If the support holds, the Descending Triangle pattern suggests a rebound toward current levels.
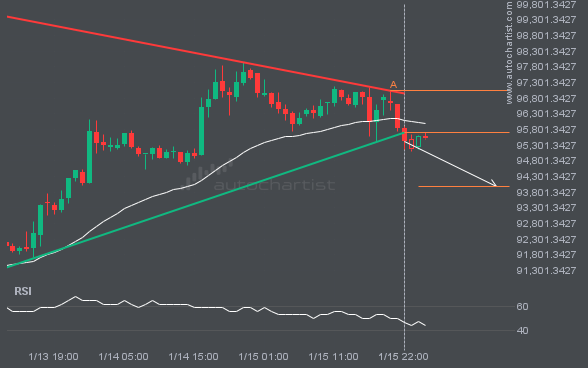
BTCUSD has broken through the support line, which it has tested twice before. We have seen it retrace from this line before, so wait for confirmation of the breakout before trading. If this new trend persists, a target level around 93969.6210 may materialize within the next 14 hours.
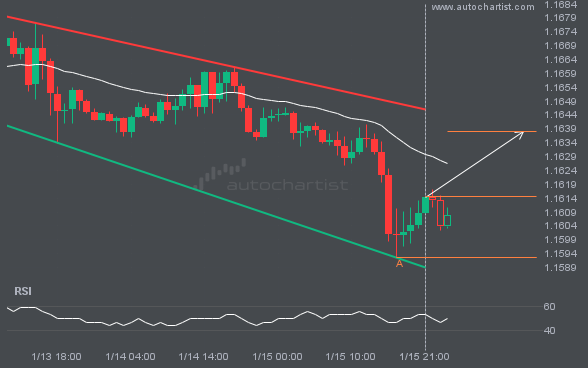
EURUSD is trapped in a Channel Down formation, implying that a breakout is imminent. This is a strong trade setup for both trend and swing traders. It is now approaching a support line that has been tested before. Divergence watchers may be optimistic about a potential breakout, which could mark the start of a new […]
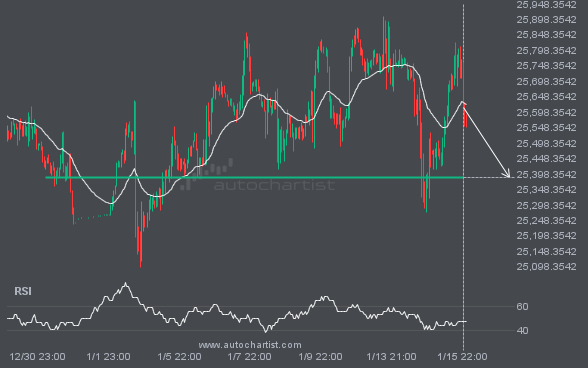
NAS100 is heading toward 25386.9648 and could reach this level within the next 3 days. It has tested this level numerous times in the past, and this time could be no different, ending in a rebound rather than a breakout. If a breakout does not occur, we may see a retracement back to current levels.
Enjoy Access to Premium Autochartist
Trading Tools - Sign Up and Explore for Free Now!
Autochartist provides an extensive analytics toolset with features to take your trading to the next level. Empower your day-to-day trading decisions with an unrivalled breadth and depth of analysis driven by advanced algorithms, powerful big-data technology, and user-friendly trading tools.