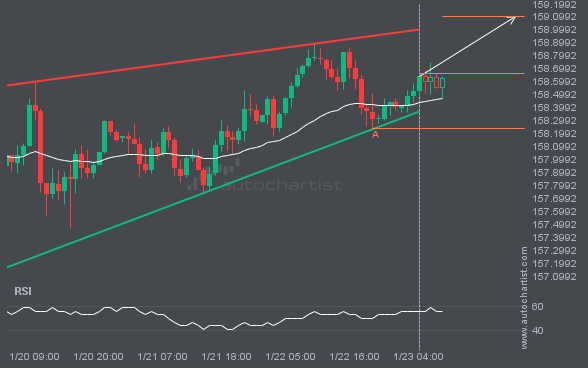
An emerging Rising Wedge pattern has been detected for USDJPY on the 1 hour chart. There may be a move toward 159.1024 in the next few candles. Once it reaches the resistance, it may continue its bullish run or revert to current price levels.
S&P500 is moving toward a resistance line. Since it has retraced from this line before, we may see either a breakout through it or a rebound to current levels. It has touched this line multiple times in the past 4 days and may test it again within the next 21 hours.
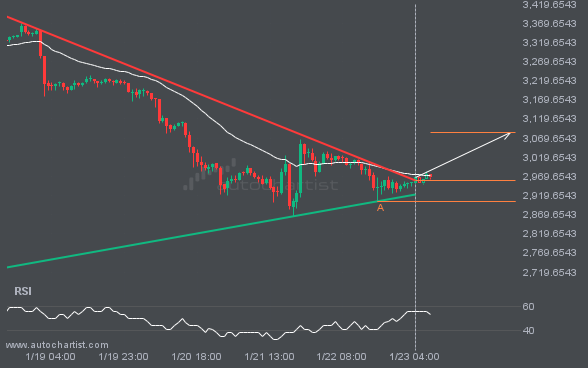
This trade setup on ETHUSD formed after a period of consolidation, during which the price moved mostly sideways before choosing a longer-term direction. Following the bullish breakout through resistance, the price could move toward 3083.1591.
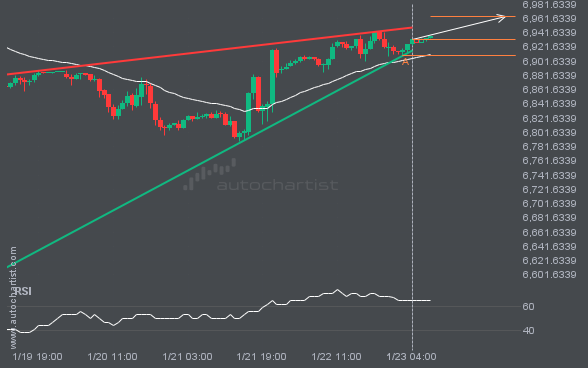
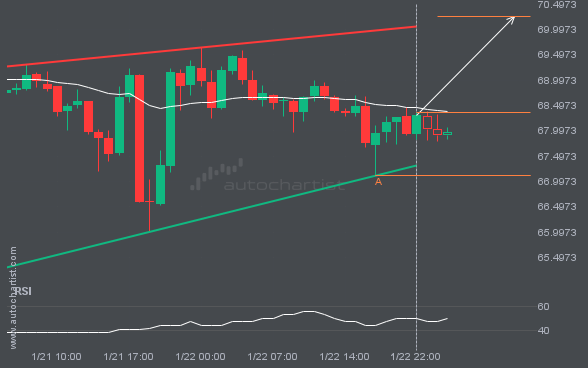
Triangle pattern identified on GBPJPY has broken through a resistance level, with price momentum continuing to move upward. This presents a solid trading opportunity, with the price expected to reach 214.2830 in the next 2.
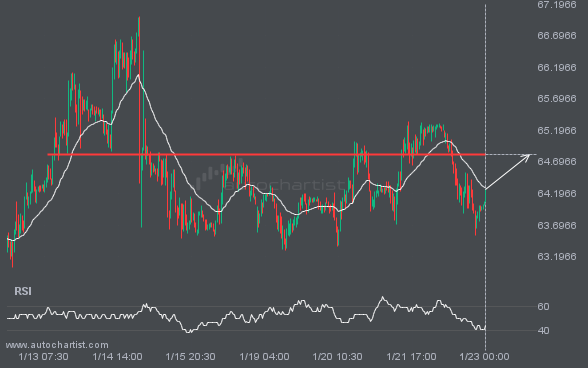
BRN/USD is approaching the line at 64.8140. If this move continues, the price of BRN/USD could test 64.8140 within the next 2 days. But do not rush to trade. It has tested this line many times in the past, so the move could be short-lived and end in a rebound.
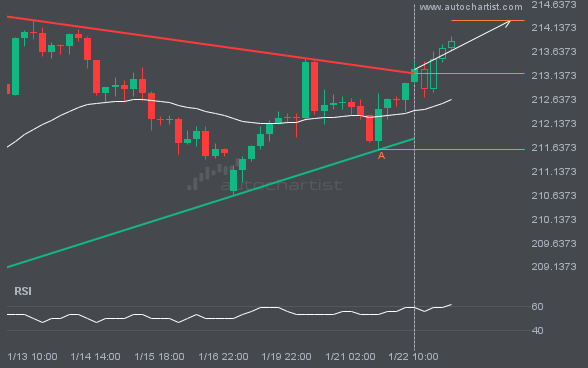
LTCUSD is moving toward a resistance line. Since it has retraced from this line before, we may see either a breakout through it or a rebound to current levels. It has touched this line multiple times in the past 2 days and may test it again within the next 9 hours.
Enjoy Access to Premium Autochartist
Trading Tools - Sign Up and Explore for Free Now!
Autochartist provides an extensive analytics toolset with features to take your trading to the next level. Empower your day-to-day trading decisions with an unrivalled breadth and depth of analysis driven by advanced algorithms, powerful big-data technology, and user-friendly trading tools.