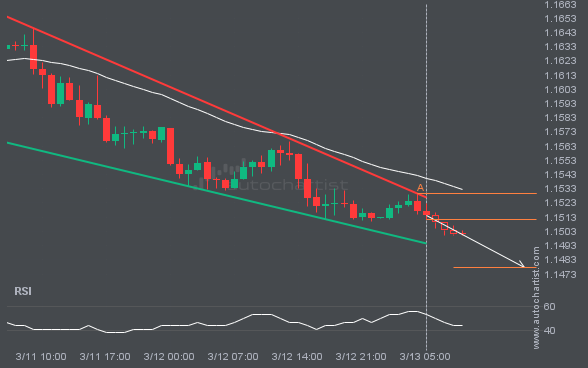
A Falling Wedge pattern was identified for EURUSD at 1.15112, suggesting it may move toward the support line at 1.1477. It may break through that line and continue the bearish trend, or reverse from it.
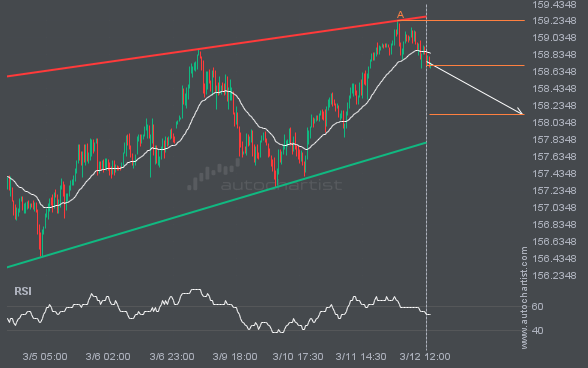
The movement of USDJPY toward the support line of a Rising Wedge is yet another test of the line it has reached numerous times in the past. This test of the line could occur within the next 2 days, but it is uncertain whether it will result in a breakout through this line or simply […]
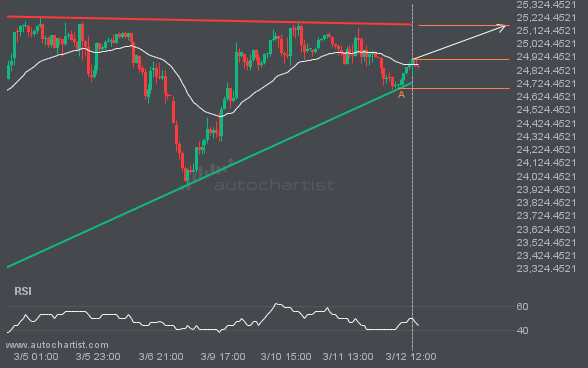
NAS100 is heading toward the resistance line of a Ascending Triangle pattern and could reach it within the next 2 days. It has tested this line numerous times before, and this time may be no different, ending in a rebound instead of a breakout. If a breakout doesn’t occur, we could see a retracement back […]
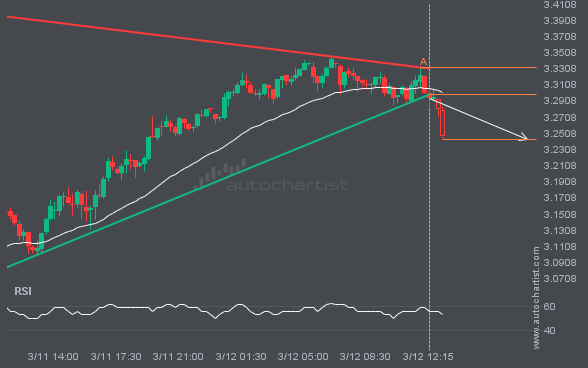
NGC/USD has broken through the support line of a Triangle pattern and suggests a possible move to 3.2426 within the next 6 hours. It has tested this line before, so it is prudent to wait for confirmation of the breakout before taking action. If the breakout is not confirmed, we could see a retracement back […]
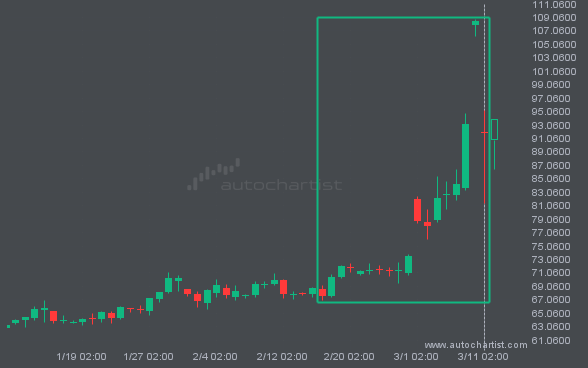
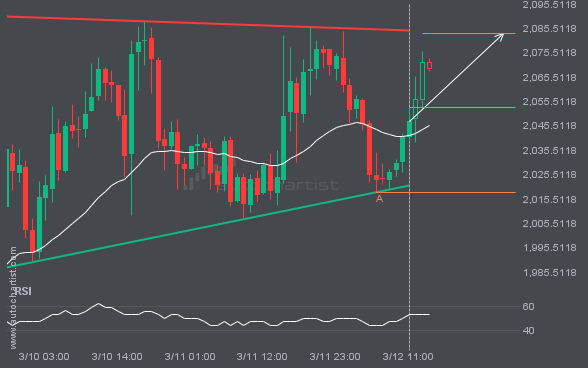
ETHUSD is heading toward the resistance line in a Ascending Triangle pattern. If this move continues, the price of ETHUSD could test 2083.3222 within the next 15 hours. It has tested this line many times before, so the move could be short-lived and may rebound as it has before.
Enjoy Access to Premium Autochartist
Trading Tools - Sign Up and Explore for Free Now!
Autochartist provides an extensive analytics toolset with features to take your trading to the next level. Empower your day-to-day trading decisions with an unrivalled breadth and depth of analysis driven by advanced algorithms, powerful big-data technology, and user-friendly trading tools.