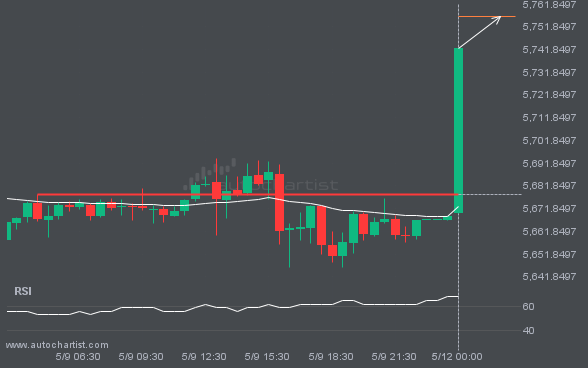
S&P500 has broken through a line of 5678.1602. If this breakout holds true, we could see the price of S&P500 heading towards 5756.3330 within the next 3 days. But don’t be so quick to trade, it has tested this line numerous times in the past, so you should probably confirm the breakout before placing any […]
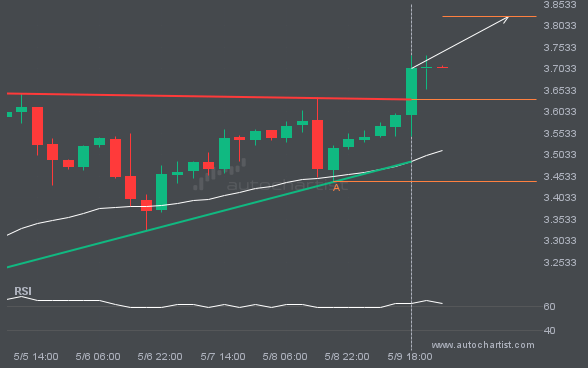
The last 10 4 hour candles on NGC/USD formed a Ascending Triangle pattern and broken out through the pattern lines, indicating a possible bullish movement towards the price level of 3.8241.
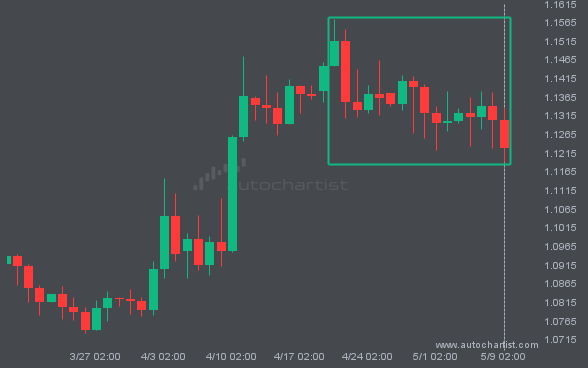
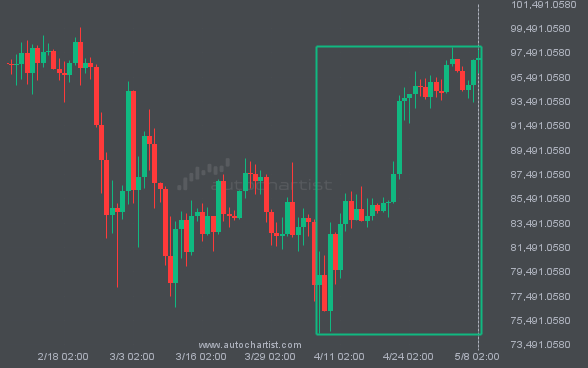
ETHUSD has experienced an extremely big movement in last 23 days. It may continue the trend, but this would make the move unprecedented in the recent past.
NAS100 has broken through the support line which it has tested twice in the past. We have seen it retrace from this line before, so one should wait for confirmation of the breakout before trading. If this new trend persists, a target level of around 19952.8545 may materialize within the next 10 hours.
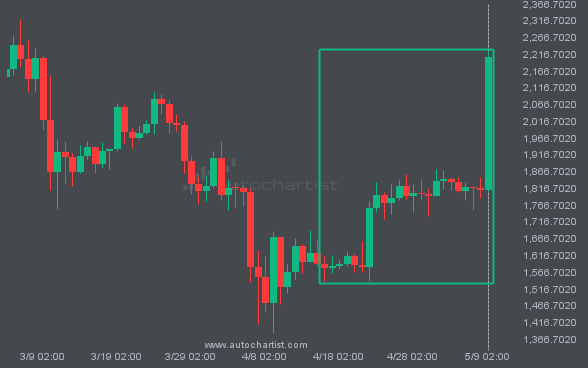
BTCUSD experienced an extremely large move that lasted 32. This movement is in the 95.0 percentile and is uncommon. It is not unusual to witness a pullback after such a big movement.
Enjoy Access to Premium Autochartist
Trading Tools - Sign Up and Explore for Free Now!
Autochartist provides an extensive analytics toolset with features to take your trading to the next level. Empower your day-to-day trading decisions with an unrivalled breadth and depth of analysis driven by advanced algorithms, powerful big-data technology, and user-friendly trading tools.