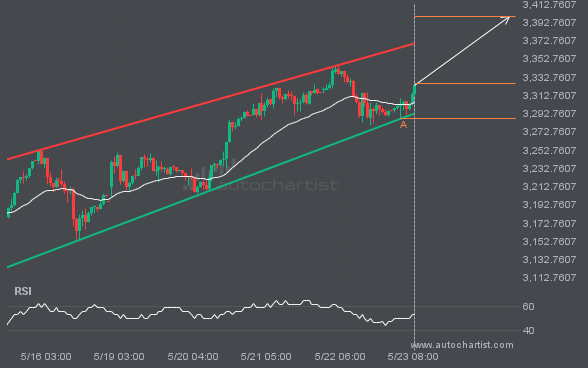
A Channel Up pattern was identified on XAUUSD at 3325.76, creating an expectation that it may move to the resistance line at 3399.0149. It may break through that line and continue the bullish trend or it may reverse from that line.
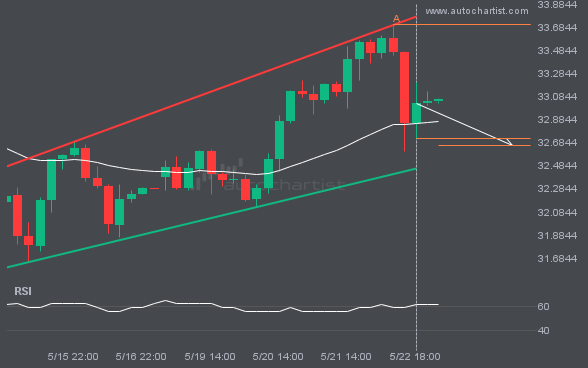
A Channel Up pattern was identified on XAGUSD at 32.71975, creating an expectation that it may move to the support line at 32.6595. It may break through that line and continue the bearish trend or it may reverse from that line.
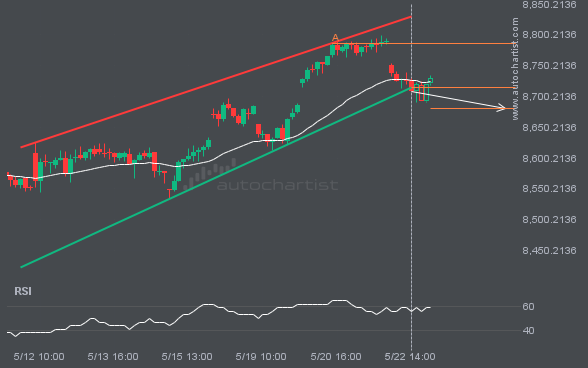
FTSE100 has broken through a support line of a Channel Up and suggests a possible movement to 8680.0178 within the next 21 hours. It has tested this line in the past, so one should probably wait for a confirmation of this breakout before taking action. If the breakout doesn’t confirm, we could see a retracement […]
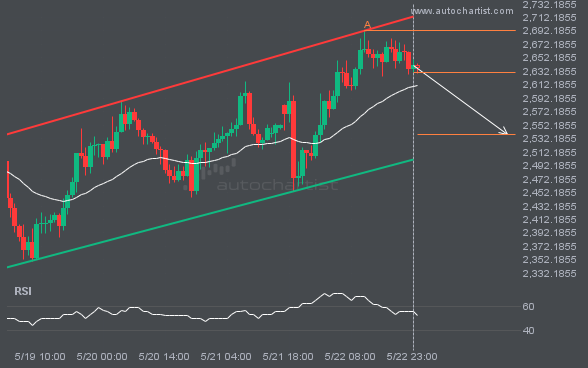
ETHUSD was identified at around 2630.85 having recently rebounded of the resistance on the 1 hour data interval. Ultimately, the price action of the stock has formed a Channel Up pattern. This squeeze may increases the chances of a strong breakout. The projected movement will potentially take the price to around the 2537.9234 level.
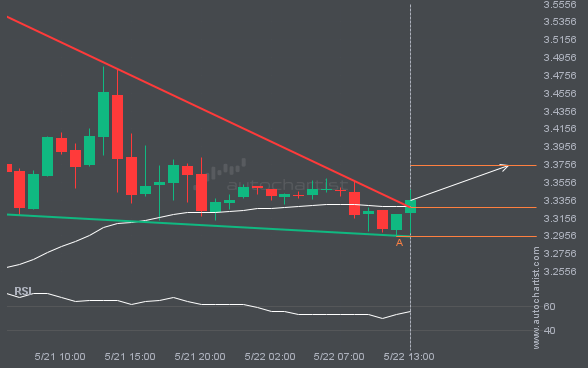
NGC/USD has broken through a resistance line of a Falling Wedge and suggests a possible movement to 3.3740 within the next 8 hours. It has tested this line in the past, so one should probably wait for a confirmation of this breakout before taking action. If the breakout doesn’t confirm, we could see a retracement […]
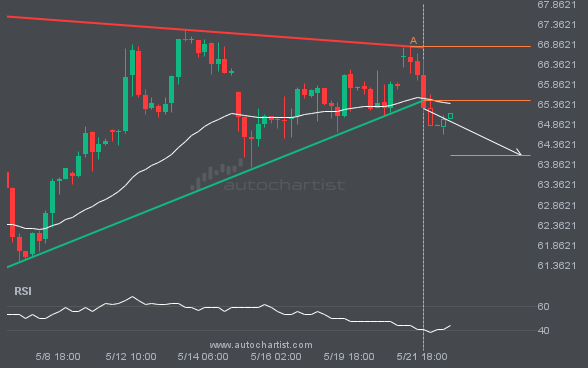
BRN/USD has broken through a support line. It has touched this line at least twice in the last 16 days. This breakout may indicate a potential move to 64.1062 within the next 3 days. Because we have seen it retrace from this position in the past, one should wait for confirmation of the breakout before […]
Enjoy Access to Premium Autochartist
Trading Tools - Sign Up and Explore for Free Now!
Autochartist provides an extensive analytics toolset with features to take your trading to the next level. Empower your day-to-day trading decisions with an unrivalled breadth and depth of analysis driven by advanced algorithms, powerful big-data technology, and user-friendly trading tools.