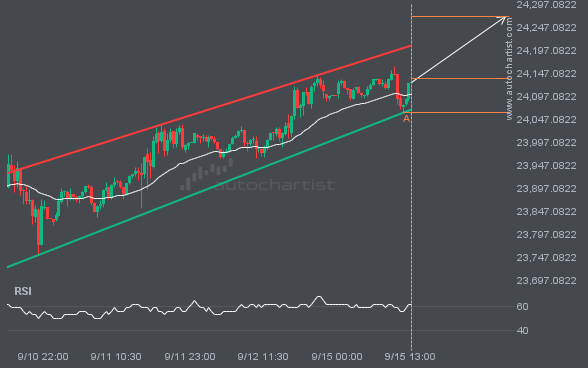
NAS100 is approaching the resistance line of a Channel Up. It has touched this line numerous times in the last 5 days. If it tests this line again, it should do so in the next 20 hours.
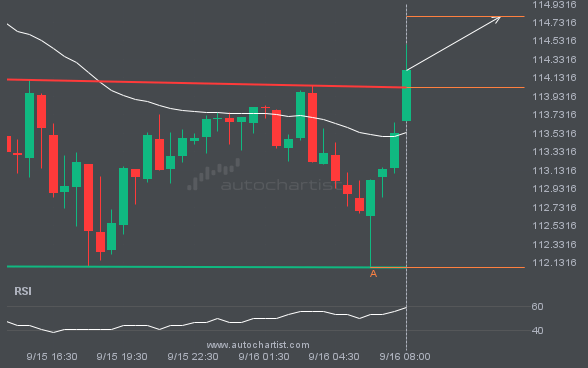
You would be well advised to confirm the breakout that has just occurred – do you believe the move through resistance to be significant? Do you have confirming indicators that the price momentum will continue? If so, look for a target of 114.7958 but consider reducing the size of your position as the price gets […]
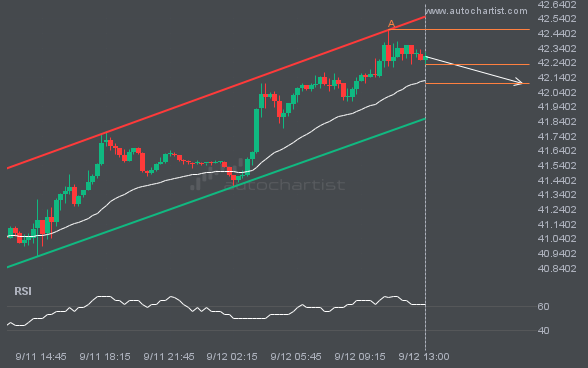
An emerging Channel Up has been detected on XAGUSD on the 15 Minutes chart. There is a possible move towards 42.0964 next few candles. Once reaching resistance it may continue its bearish run or reverse back to current price levels.
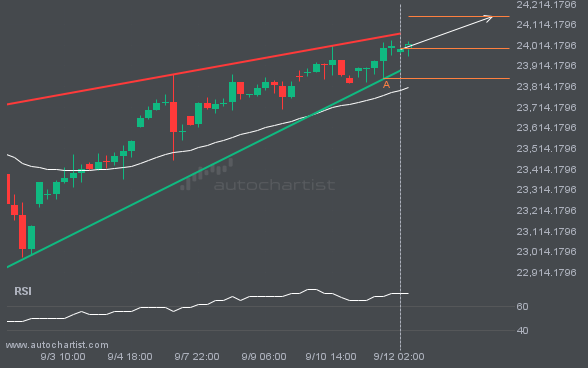
Emerging Rising Wedge detected on NAS100 – the pattern is an emerging one and has not yet broken through support, but the price is expected to move up over the next few hours. The price at the time the pattern was found was 23997.1994 and it is expected to move to 24153.4095.
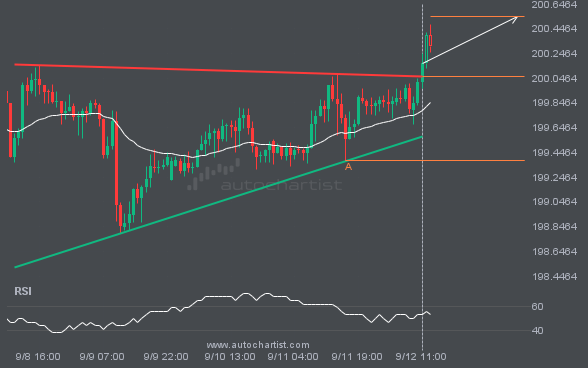
GBPJPY moved through the resistance line of a Ascending Triangle at 200.06207142857144 on the 1 hour chart. This line has been tested a number of times in the past and this breakout could mean an upcoming change from the current trend. It may continue in its current direction toward 200.5449.
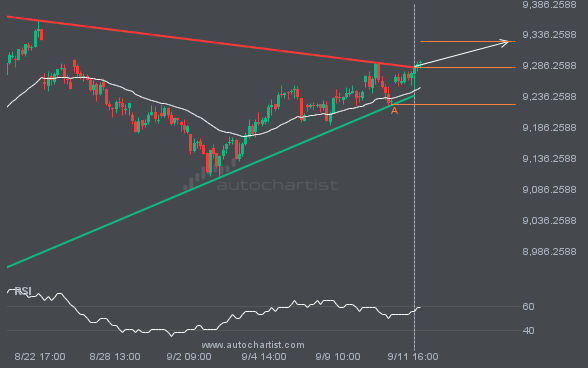
FTSE100 moved through the resistance line of a Triangle at 9283.397692307693 on the 1 hour chart. This line has been tested a number of times in the past and this breakout could mean an upcoming change from the current trend. It may continue in its current direction toward 9325.7975.
Enjoy Access to Premium Autochartist
Trading Tools - Sign Up and Explore for Free Now!
Autochartist provides an extensive analytics toolset with features to take your trading to the next level. Empower your day-to-day trading decisions with an unrivalled breadth and depth of analysis driven by advanced algorithms, powerful big-data technology, and user-friendly trading tools.