MARKET ANALYSIS

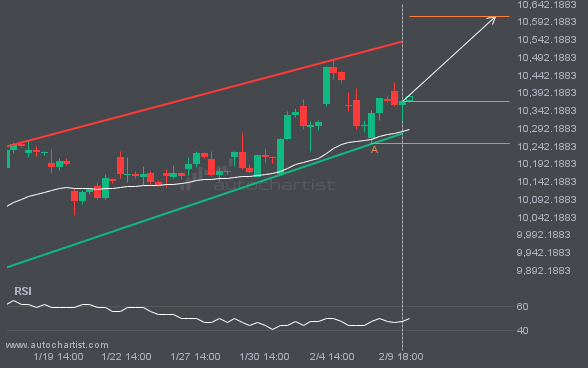
FTSE100 is trapped in a Channel Up formation, implying that a breakout is Imminent. This is a great trade-setup for both trend and swing traders. It is now approaching a resistance line that has been tested in the past. Divergence opportunists may be very optimistic about a possible breakout and this may be the start of a new trend. It may also be that this convergence factor may result in the ideal setup for swing traders that are on the lookout for a possible bounce-back. Whatever happens, an initial move towards 8637.3486 is expected in the short term.

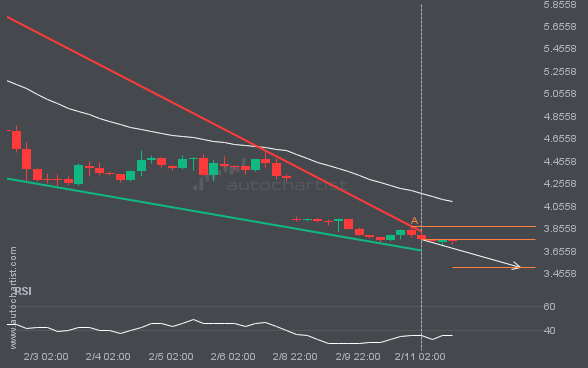
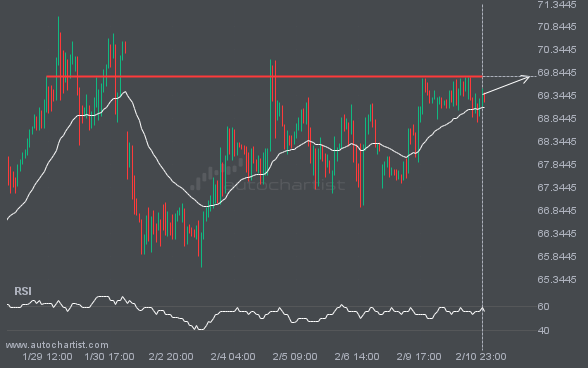
EURUSD is moving towards a resistance line. Because we have seen it retrace from this line before, we could see either a break through this line, or a rebound back to current levels. It has touched this line numerous times in the last 5 days and may test it again within the next 7 hours.

An unexpected large move has occurred on FTSE100 Daily chart beginning at 7677.0 and ending at 8597.81. Is this a sign of something new? What can we expect in the future?

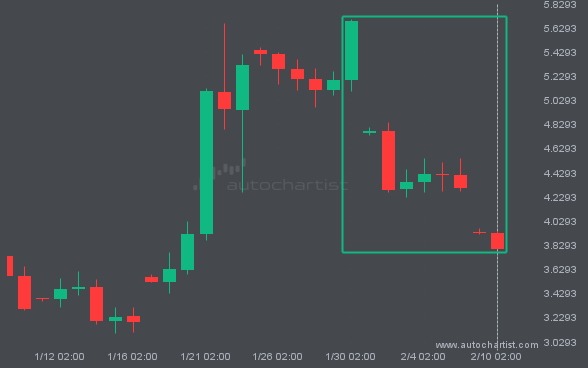
XAGUSD is moving towards a support line which it has tested numerous times in the past. We have seen it retrace from this line before, so at this stage it isn’t clear whether it will breach this line or rebound as it did before. If XAGUSD continues in its current trajectory, we could see it […]

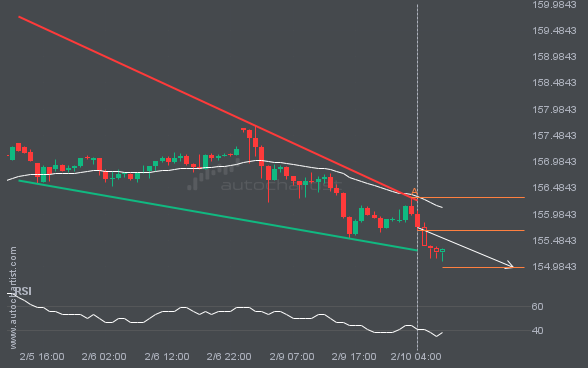
The price of GBPJPY in heading in the direction of 189.3802. Despite the recent breakout through 190.7575 it is possible that it will struggle to gain momentum to the forecast price and move back in the other direction. This has happened many times in the past so watch for a possible bounce back.

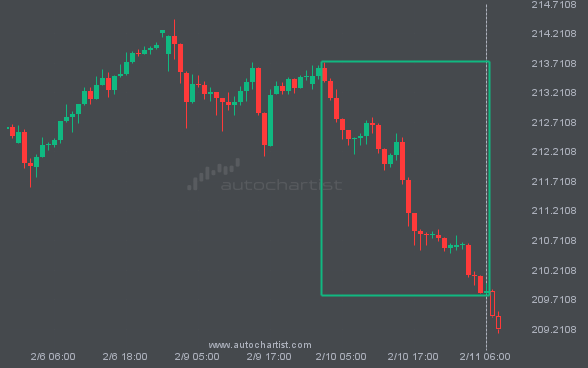
XAUUSD rose sharply for 4 days – which is an excessively big movement for this instrument; exceeding the 98% of past price moves. Even if this move is a sign of a new trend in XAUUSD there is a chance that we will witness a correction, no matter how brief.

ETHUSD has broken through a line of 1780.0100. If this breakout holds true, we could see the price of ETHUSD heading towards 1731.8459 within the next 2 days. But don’t be so quick to trade, it has tested this line numerous times in the past, so you should probably confirm the breakout before placing any […]

S&P500 is once again retesting a key horizontal support level at 5610.4102. It has tested this level 4 times in the recent past and could simply bounce off like it did last time. However, after this many tries, maybe it’s ready to start a new trend.