Skip to content
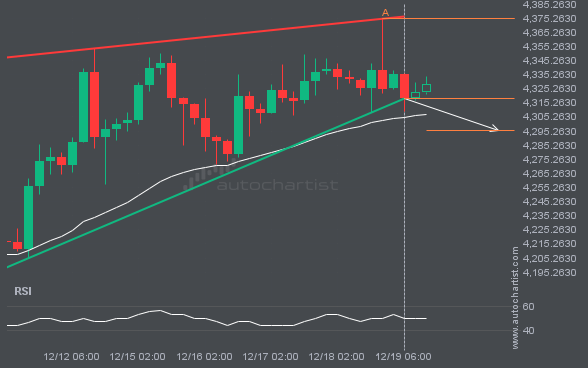
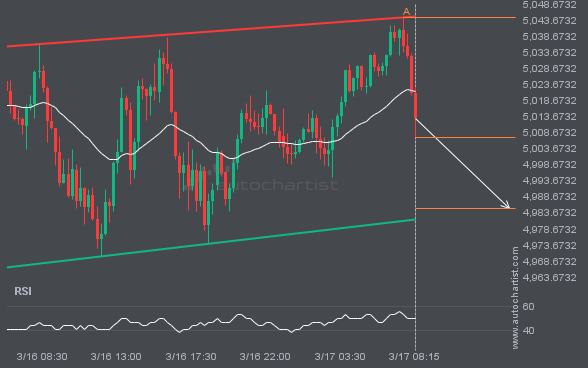
 XAUUSD has broken through the support line, which it has tested twice before. We have seen it retrace from this line before, so wait for confirmation of the breakout before trading. If this new trend persists, a target level around 4295.5352 may materialize within the next 2 days.