MARKET ANALYSIS

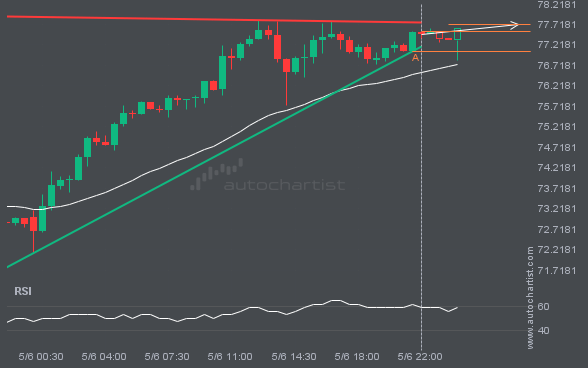
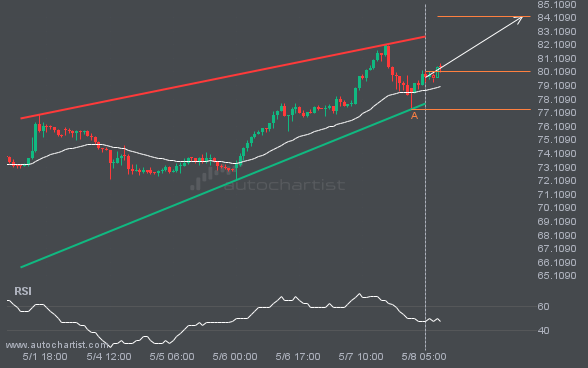
The movement of XAGUSD toward the resistance line of a Ascending Triangle is yet another test of the line it has reached numerous times in the past. This test of the line could occur within the next 5 hours, but it is uncertain whether it will result in a breakout through this line or simply rebound to current levels.

NAS100 is heading toward the resistance line in a Channel Up pattern. If this move continues, the price of NAS100 could test 29362.2249 within the next 3 days. It has tested this line many times before, so the move could be short-lived and may rebound as it has before.

XAGUSD is moving toward a resistance line. Since it has retraced from this line before, we may see either a breakout through this line or a rebound to current levels. It has touched this line numerous times in the last 7 days and may test it again within the next 2 days.

S&P500 is moving toward a support line. Since it has retraced from this line before, we may see either a breakout through this line or a rebound to current levels. It has touched this line numerous times in the last 9 days and may test it again within the next 2 days.

A strong resistance level has been identified at 113.3880 on the 15 Minutes BRN/USD chart. BRN/USD is likely to test this level soon.

The last 3 1 hour candles on NGC/USD have formed a Triangle pattern and broken out through the pattern lines, indicating a possible bullish movement toward the price level at 2.6716.

EURUSD is approaching a critical level that could be a key deciding factor for what comes next. We may see this trajectory continue to test and break through 1.1791, unless it loses momentum and pulls back to current levels.

XAUUSD is moving toward a resistance line. Since it has retraced from this line before, we may see either a breakout through this line or a rebound to current levels. It has touched this line numerous times in the last 19 hours and may test it again within the next 6 hours.