...
MARKET ANALYSIS

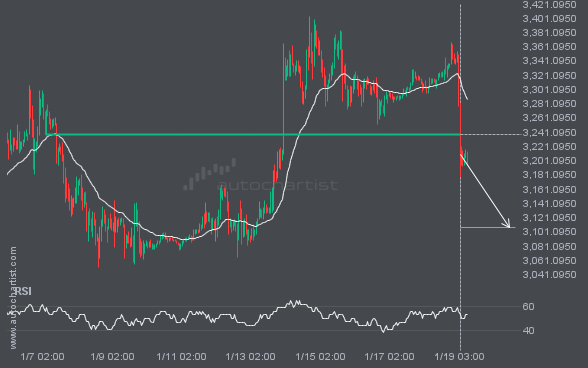
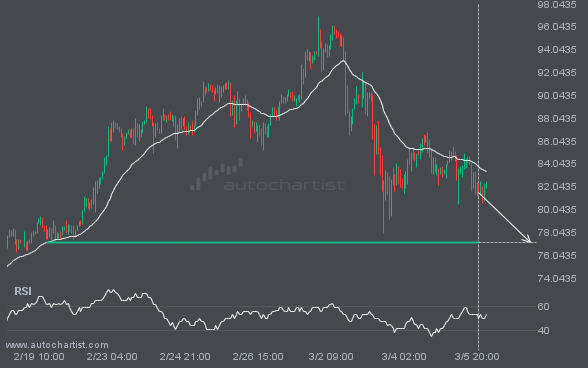
ETHUSD has broken through a support line. Since it has previously retraced from this price, wait for confirmation of the breakout before trading. It has touched this line several times over the past 13 days. This suggests a possible target around 3107.3479 within the next 3 days.

BTCUSD is heading toward the resistance line of a Channel Down pattern and could reach it within the next 6 hours. It has tested this line numerous times before, and this time may be no different, ending in a rebound instead of a breakout. If a breakout doesn’t occur, we could see a retracement back […]

An emerging Descending Triangle pattern in its final wave has been identified on the GBPJPY 30 Minutes chart. After a strong bearish run, GBPJPY is heading toward the upper triangle trendline, with possible resistance at 207.4598. If the support holds, the Descending Triangle pattern suggests a rebound toward current levels.

NAS100 just posted a 2.55% move over the past 15 hours—a move unlikely to go unnoticed by any trading style.

FTSE100 is heading toward 10305.5098 and could reach this level within the next 17 hours. It has tested this level numerous times in the past, and this time could be no different, ending in a rebound rather than a breakout. If a breakout does not occur, we may see a retracement back to current levels.

A Rising Wedge pattern was identified for BRN/USD at 69.774, suggesting it may move toward the support line at 69.1426. It may break through that line and continue the bearish trend, or reverse from it.

A strong resistance level has been identified at 2016.8300 on the 15 Minutes ETHUSD chart. ETHUSD is likely to test this level soon.