Skip to content
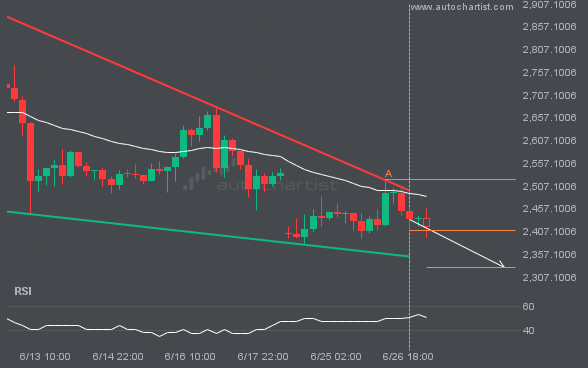
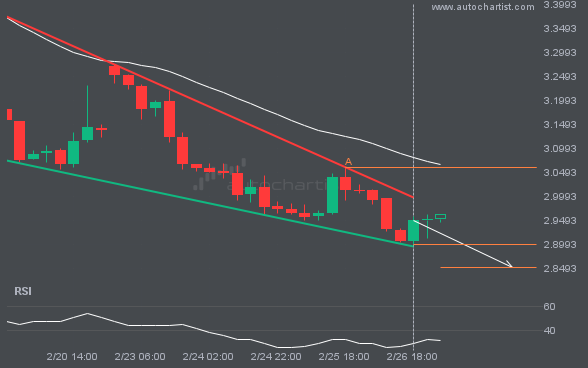
 Emerging Falling Wedge pattern in its final wave was identified on the ETHUSD 4 hour chart. After a strong bearish run, we find ETHUSD heading towards the upper triangle line with a possible resistance at 2328.5380. If the support shows to hold, the Falling Wedge pattern suggests a rebound back towards current levels.