...
MARKET ANALYSIS

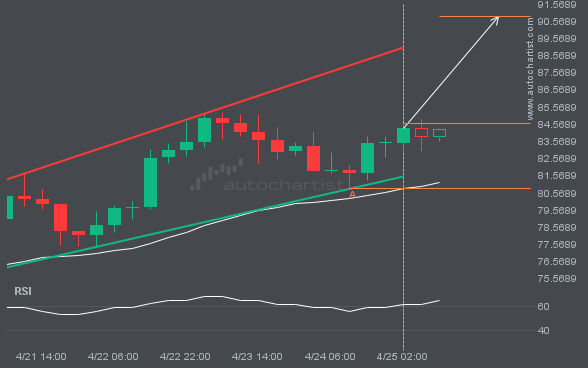
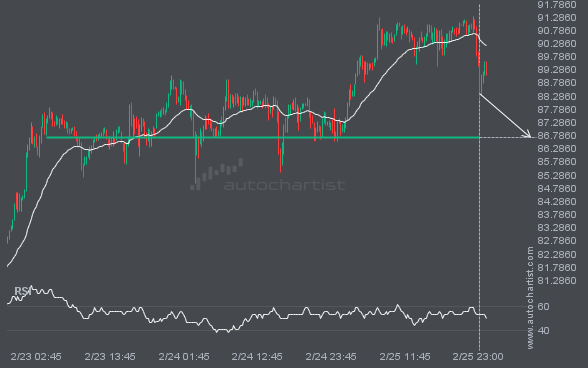
LTCUSD is heading towards the resistance line of a Channel Up. If this movement continues, the price of LTCUSD could test 90.8387 within the next 17 hours. It has tested this line numerous times in the past, so this movement could be short-lived and end up rebounding just like it did in the past.

LTCUSD is moving toward a resistance line it has tested many times. It has retraced from this line before, so it’s unclear whether it will break through or rebound again. If LTCUSD continues on its current trajectory, it could reach 59.9073 within the next 2 days.

FTSE100 is approaching a support line at 10138.6699. If it hits the support line, it may break through this level to continue the bearish trend, or it may return to current levels.

NGC/USD recorded an exceptional 10.43% move over the last 18 hours. Whether you follow trends or look for reversals, this move is hard to ignore.

S&P500 has broken through 6946.9600, which it has tested many times before. We have also seen it retrace from this level. If this new trend persists, S&P500 may be heading towards 6822.6382 within the next 3 days.

The price of XAUUSD is heading toward 4833.3403. Despite the recent breakout through 5066.8848, it may struggle to gain momentum to reach the forecast price and could move back in the other direction. This has happened many times in the past, so watch for a possible bounce back.

A breakout of EURUSD through the support line of a Triangle could signal what’s ahead. If the breakout persists, we may see EURUSD’s price test 1.1842 within the next 2 days.