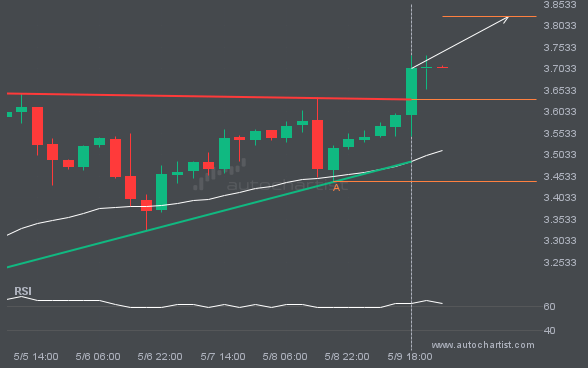
The last 10 4 hour candles on NGC/USD formed a Ascending Triangle pattern and broken out through the pattern lines, indicating a possible bullish movement towards the price level of 3.8241.
 Skip to content
 The last 10 4 hour candles on NGC/USD formed a Ascending Triangle pattern and broken out through the pattern lines, indicating a possible bullish movement towards the price level of 3.8241.
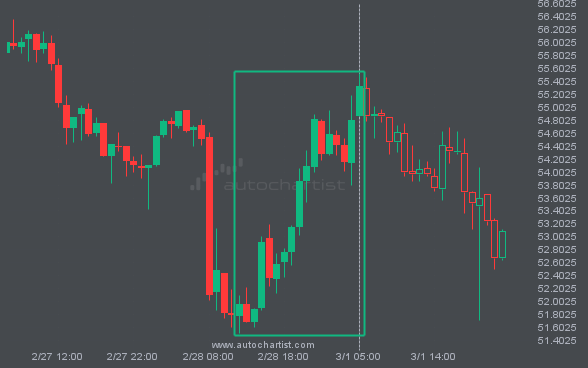
LTCUSD has moved higher by 6.47% from 51.96 to 55.32 in the last 17 hours.
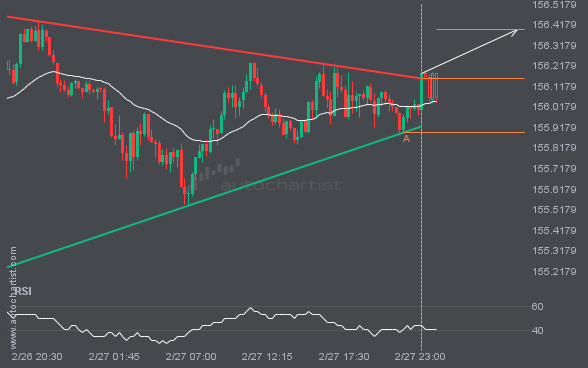
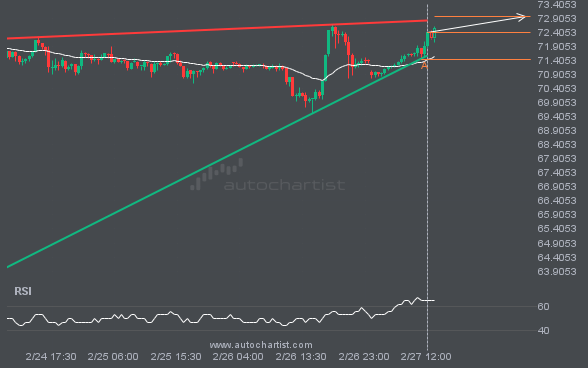
USDJPY has broken through a resistance line of the Triangle chart pattern. If this breakout holds, we may see the price of USDJPY test 156.3917 within the next 7 hours. But don’t rush to trade. It has tested this line before, so confirm the breakout before taking any action.
BRN/USD is moving toward a resistance line. Since it has retraced from this line before, we may see either a breakout through it or a rebound to current levels. It has touched this line multiple times in the past 2 days and may test it again within the next 5 hours.
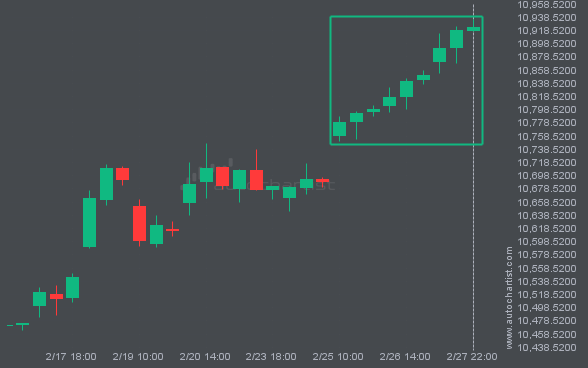
After posting 9 consecutive bullish candles over 3 days, consider where FTSE100 may be headed next: a continuation of the current upward trend or a reversal.
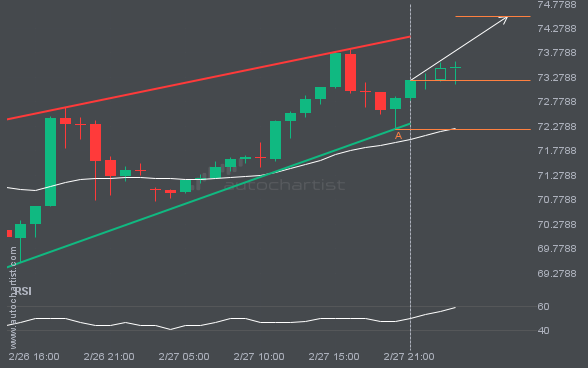
BRN/USD is trapped in a Rising Wedge formation, implying that a breakout is imminent. This is a strong trade setup for both trend and swing traders. It is now approaching a support line that has been tested before. Divergence watchers may be optimistic about a potential breakout, which could mark the start of a new […]
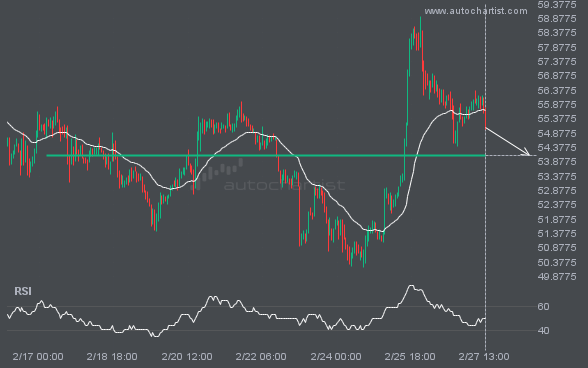
LTCUSD is about to retest a key horizontal support level near 54.0800. It has tested this level 6 times recently and may simply bounce off it, as it did last time. However, after so many attempts, it may be ready to start a new trend.
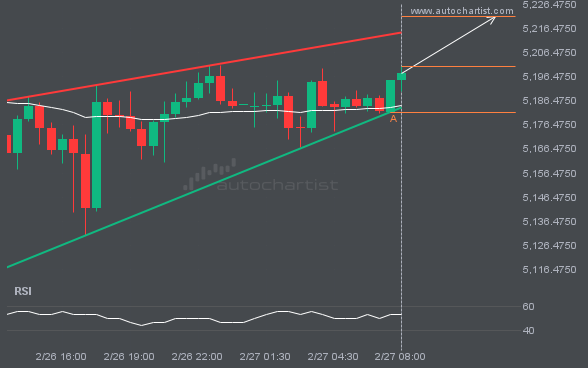
XAUUSD is heading toward the resistance line in a Rising Wedge pattern. If this move continues, the price of XAUUSD could test 5221.2819 within the next 5 hours. It has tested this line many times before, so the move could be short-lived and may rebound as it has before.