...
MARKET ANALYSIS

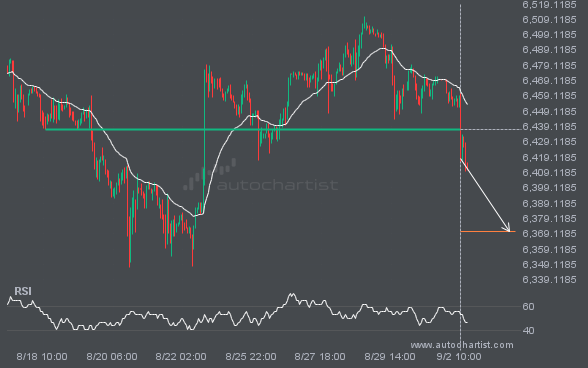
S&P500 has broken through a support line. It has touched this line numerous times in the last 15 days. This breakout shows a potential move to 6370.5698 within the next 3 days. Because we have seen it retrace from this level in the past, one should wait for confirmation of the breakout.

BRN/USD has broken through a line of 67.2735 and suggests a possible movement to 66.5176 within the next 3 days. It has tested this line numerous times in the past, so one should wait for a confirmation of this breakout before taking any action. If the breakout doesn’t confirm, we could see a retracement back […]

Emerging Rising Wedge pattern in its final wave was identified on the USDJPY 4 hour chart. After a strong bullish run, we find USDJPY heading towards the upper triangle line with a possible resistance at 149.6137. If the resistance shows to hold, the Rising Wedge pattern suggests a rebound back towards current levels.

ETHUSD has broken through a resistance line. It has touched this line at least twice in the last 9 days. This breakout may indicate a potential move to 4516.0809 within the next 2 days. Because we have seen it retrace from this position in the past, one should wait for confirmation of the breakout before […]

A Channel Up pattern was identified on NGC/USD at 2.939, creating an expectation that it may move to the resistance line at 3.0823. It may break through that line and continue the bullish trend or it may reverse from that line.

S&P500 is moving towards a line of 6479.7700 which it has tested numerous times in the past. We have seen it retrace from this position in the past, so at this stage it isn’t clear whether it will breach this price or rebound as it did before. If S&P500 continues in its current trajectory, we […]

EURUSD is moving towards a resistance line which it has tested numerous times in the past. We have seen it retrace from this line before, so at this stage it isn’t clear whether it will breach this line or rebound as it did before. If EURUSD continues in its current trajectory, we could see it […]

BTCUSD is about to retest a key horizontal resistance level near 111880.6797. It has tested this level 3 times in the recent past and could simply bounce off like it did last time. However, after this many tries, maybe it’s ready to start a new trend.