MARKET ANALYSIS

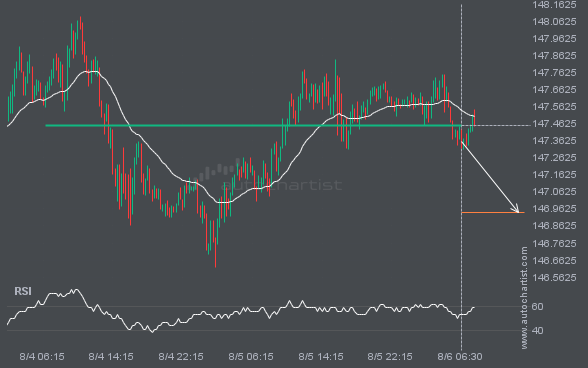
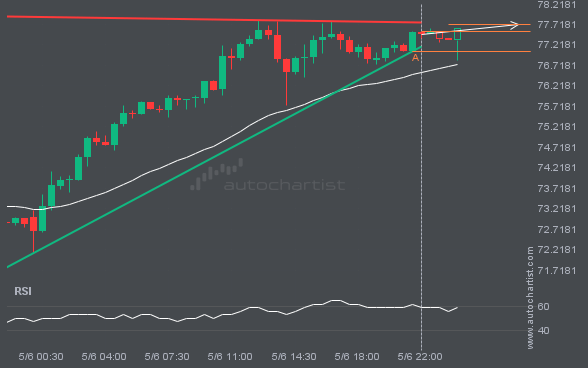
USDJPY has broken through a line of 147.4525. If this breakout holds true, we could see the price of USDJPY heading towards 146.9438 within the next 10 hours. But don’t be so quick to trade, it has tested this line numerous times in the past, so you should probably confirm the breakout before placing any trades.

S&P500 is approaching a resistance line at 6317.6602. If it hits the resistance line, it may break through this level to continue the bullish trend, or it may turn around back to current levels.

An emerging Channel Down has been detected on NGC/USD on the 4 hour chart. There is a possible move towards 2.8651 next few candles. Once reaching resistance it may continue its bearish run or reverse back to current price levels.

XAGUSD is moving towards a key resistance level at 37.2396. This is a previously tested level for XAGUSD. This could be a good trading opportunity, either at the spot price, or after breaching this level.

The price of LTCUSD in heading back to the support area. It is possible that it will struggle to break through it and move back in the other direction. The price may eventually break through, but typically the price retreats from the level a number of times before doing so.

A strong support level has been breached at 147.6935 on the 1 hour USDJPY chart. Technical Analysis theory forecasts a movement to 146.5455 in the next 3 days.

FTSE100 is approaching a support line at 8947.0098. If it hits the support line, it may break through this level to continue the bearish trend, or it may turn around back to current levels.

USDJPY is approaching the support line of a Channel Up. It has touched this line numerous times in the last 3 days. If it tests this line again, it should do so in the next 20 hours.