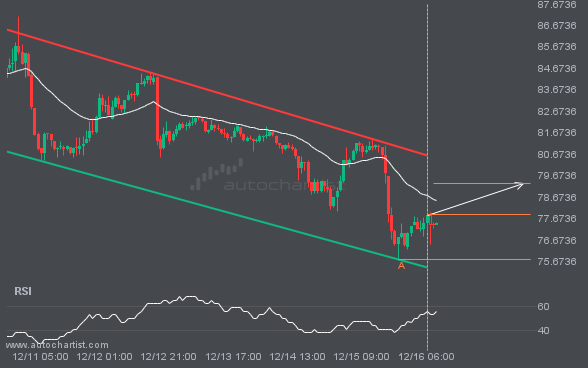
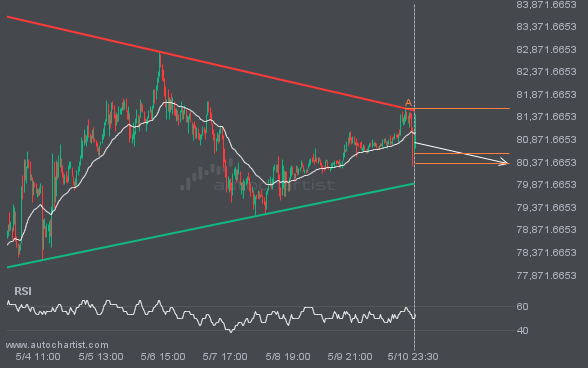
An emerging Channel Down pattern in its final wave has been identified on the LTCUSD 1 hour chart. After a strong bullish run, LTCUSD is heading toward the upper triangle trendline, with possible resistance at 79.3020. If the resistance holds, the Channel Down pattern suggests a rebound toward current levels.