MARKET ANALYSIS

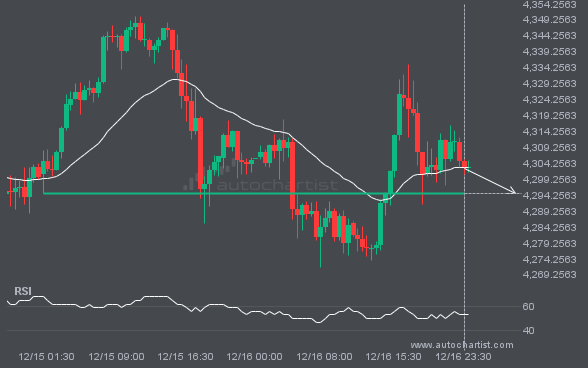
XAUUSD is heading toward 4294.9048 and could reach this level within the next 10 hours. It has tested this level numerous times in the past, and this time could be no different, ending in a rebound rather than a breakout. If a breakout does not occur, we may see a retracement back to current levels.

A Falling Wedge pattern was identified for NGC/USD at 3.7565, suggesting it may move toward the support line at 3.5119. It may break through that line and continue the bearish trend, or reverse from it.

BRN/USD is approaching the line at 69.7610. If this move continues, the price of BRN/USD could test 69.7610 within the next 2 days. But do not rush to trade. It has tested this line many times in the past, so the move could be short-lived and end in a rebound.

XAUUSD is moving toward a resistance line. Because it has retraced from this level in the past, we may see either a breakout through this line or a rebound to current levels. It has touched this line multiple times over the last 15 days and may test it again within the next 3 days.

USDJPY is heading toward the support line of a Falling Wedge pattern and could reach it within the next 15 hours. It has tested this line numerous times before, and this time may be no different, ending in a rebound instead of a breakout. If a breakout doesn’t occur, we could see a retracement back […]

NGC/USD has moved lower by 33.27% from 5.686 to 3.7945 in the last 12 days.

An emerging Channel Up pattern has been detected for FTSE100 on the 4 hour chart. There may be a move toward 10606.8650 in the next few candles. Once it reaches the resistance, it may continue its bullish run or revert to current price levels.