...
MARKET ANALYSIS

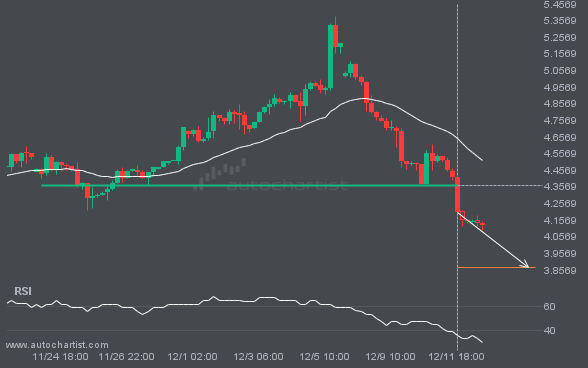
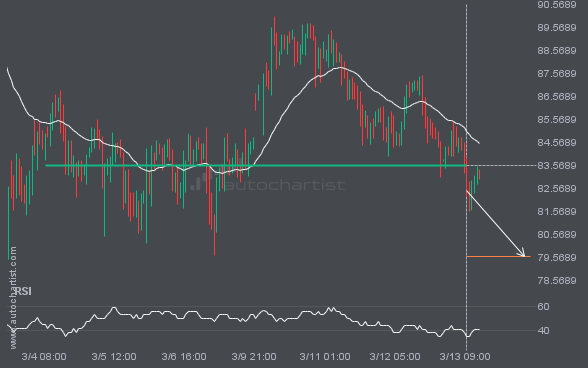
The breakout of NGC/USD through the 4.3665 price line is a breach of an important psychological price level that it has tested numerous times in the past. If this breakout persists, NGC/USD could test 3.8732 within the next 3 days. One should always be cautious before placing a trade and wait for confirmation of the breakout.

The price of USDJPY is heading toward 158.9628. Despite the recent breakout through 158.2810, it may struggle to gain momentum to reach the forecast price and could move back in the other direction. This has happened many times in the past, so watch for a possible bounce back.

BTCUSD is moving toward a support line it has tested many times. It has retraced from this line before, so it’s unclear whether it will break through or rebound again. If BTCUSD continues on its current trajectory, it could reach 84518.4630 within the next 17 hours.

The price of S&P500 is heading back toward the resistance area. It may struggle to break through and could reverse direction. The price may eventually break through, but it typically retreats from the level several times before doing so.

GBPJPY is moving toward a key support level at 210.5175. GBPJPY has tested this level 5 times before, and on each occasion it has bounced off. Could this be the time it finally breaks through?

BRN/USD is trapped in a Rising Wedge formation, implying that a breakout is imminent. This is a strong trade setup for both trend and swing traders. It is now approaching a support line that has been tested before. Divergence watchers may be optimistic about a potential breakout, which could mark the start of a new […]

The price of LTCUSD is heading back toward the resistance area. It may struggle to break through and could reverse direction. The price may eventually break through, but it typically retreats from the level several times before doing so.